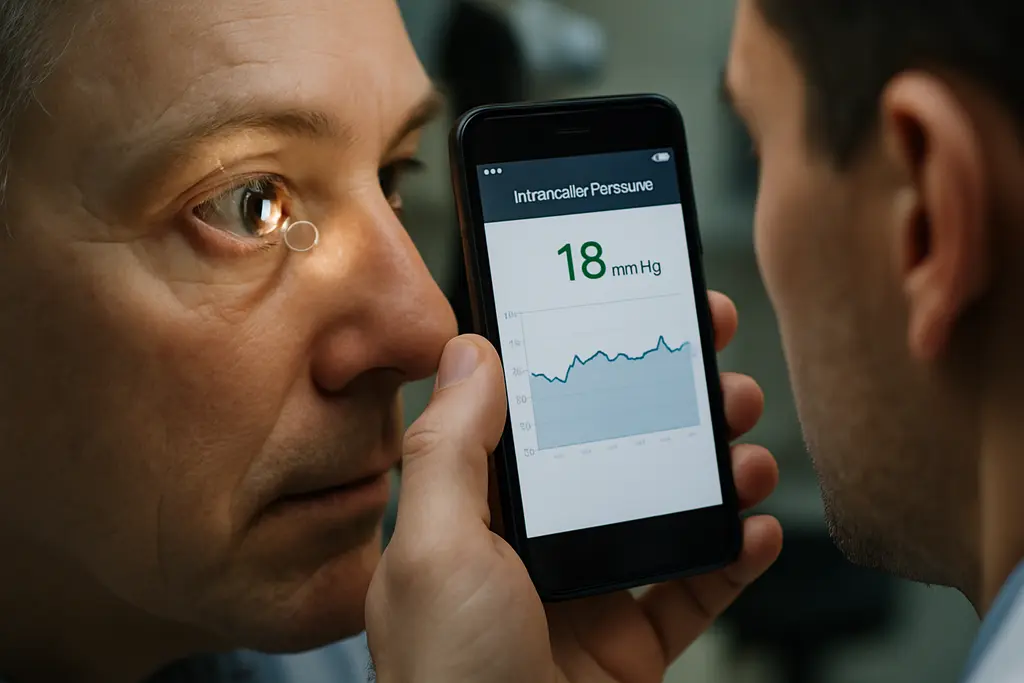
Wireless IOP monitoring is changing how researchers think about intraocular pressure, or IOP, because the highest pressure readings may occur outside a standard clinic visit. For athletes who already track sleep, recovery, hydration, and visual performance, the research is relevant but not ready to become a stand-alone screening or treatment tool.
The key shift is simple: office-hour pressure is only one slice of a 24-hour biological pattern. In glaucoma care, IOP has long been measured in clinics, often during daytime hours. Recent sensor studies suggest that peaks, troughs, and fluctuation patterns may add information about risk, especially for people already diagnosed with glaucoma or being monitored as suspects. That does not mean every athlete needs continuous eye-pressure tracking. It does mean sports vision clinicians should pay attention to the timing of eye measurements, symptoms, and risk history.
What wireless IOP monitoring Shows About Daily Pressure
Why wireless IOP monitoring Catches Hidden Peaks
The ARGOS-02 multicenter study, published on March 1, 2026, used an implanted intraocular telemetry sensor in people with primary open-angle glaucoma. In that population, 50.6% of IOP peaks occurred around 4–5 a.m., while 42.3% of troughs occurred around 11 p.m.–12 a.m. The same report found that five evenly spaced measurements over 18 waking hours were sufficient to characterize the 24-hour IOP rhythm in the study population ARGOS-02 study.
That is the practical promise of wireless IOP monitoring: it can reveal pressure behavior that a single office measurement may miss. The ARGOS-02 data set included 80,495 total IOP readings from 22 patients, with a mean age of about 67.8 years and mean follow-up of about 6.6 years. In actual use, however, participants recorded an average of four measurements over 14 hours. That gap matters. Even when the technology can support more complete daily profiling, patient behavior still affects the usefulness of the data.
Measurement Frequency And Adherence
For sports settings, adherence is a familiar issue. Athletes may comply well with training logs but less consistently with medical measurements that feel distant from performance. The ARGOS-02 finding that five readings over 18 waking hours may characterize a daily rhythm is helpful, yet the real-world average of four readings over 14 hours shows a likely implementation barrier. A device does not create meaningful data unless the measurement schedule is realistic, repeatable, and clinically interpreted.
This matters for glaucoma because risk is not determined by a single pressure number alone. Eye structure, visual field status, family history, age, corneal factors, and other clinical findings can affect how an eye tolerates pressure. For a risk-based approach to follow-up, see this related discussion of glaucoma suspect monitoring. Sensor-based pressure patterns may add context, but they should sit beside standard examination findings rather than replace them.
Glaucoma Risk Signals Beyond Office Hours
Peaks, Troughs, And Fluctuation
Several research updates point in the same direction: pressure peaks and fluctuation may matter as much as daytime averages. In the ARGOS-03 follow-up case series described in the research record, peak IOP and IOP fluctuations measured by an implantable sensor were significantly associated with retinal nerve fiber layer thinning, while mean IOP measured in clinic with Goldmann applanation tonometry was not associated in that small sample. The case series involved eight eyes of eight patients and roughly 7,200 self-measurements per patient over about 2.9 years, so it is informative but not definitive.
Earlier contact-lens sensor work also supports attention to 24-hour patterns. In one study of 54 patients with open-angle glaucoma, faster visual field progression was associated with higher 24-hour magnitude fluctuations and larger area-under-the-curve signals than slower progression. Another study of 35 glaucoma suspects and patients found repeatable nocturnal acrophase in 62.9% of participants across sessions spaced one week apart. These findings strengthen the idea that timing and fluctuation deserve study, although contact-lens sensor output is not the same as direct millimeters of mercury pressure in every context.
What The Evidence Does Not Prove
These studies do not prove that all people with higher nighttime peaks will progress, or that measuring more often automatically prevents glaucoma damage. Most available human data are from patients with glaucoma, glaucoma suspects, or small case series. The evidence is strongest for saying that daily pressure rhythms can be measured and may carry clinically relevant information. It is weaker for broad claims about universal screening, athlete performance, or specific treatment changes based only on sensor output.
For athletes, that distinction is essential. A sprinter with no glaucoma risk factors, a cyclist with high myopia, and a retired boxer with optic nerve concerns are not the same clinical scenario. Eye-pressure rhythm data may eventually help refine individual monitoring, but current evidence does not support using these devices to diagnose glaucoma in healthy athletes without a full eye examination.
Cost And Implementation Barriers

Evidence Thresholds And Pricing
A health-technology assessment from Türkiye, published on August 24, 2026, modeled wearable or continuous IOP monitoring added to standard glaucoma care. In that setting, if the technology reduced glaucoma progression by 15%, an all-inclusive annual price of US $300 produced an incremental cost-effectiveness ratio of US $23,709 per quality-adjusted life year, within the modeled threshold range of one to three times gross domestic product per capita Scientific Reports assessment.
That is a modeling result, not proof that a specific device will reduce progression by 15% in routine practice. Cost-effectiveness depends on device price, accuracy, patient selection, clinic workflow, reimbursement policy, and whether clinicians can act on the data in ways that improve outcomes. In sports medicine, the same issue appears with many monitoring tools: data are only useful if they change decisions safely and with evidence.
Device Type And Practical Use
Implantable telemetry sensors and contact-lens sensors raise different questions. Implantable systems can provide direct internal pressure information in selected patients, but they are not casual wellness devices. Contact-lens sensors may be less invasive, yet they must prove safety, tolerability, accuracy, repeatability, and practical wear time. Research notes from 2026 include planned and active studies of hydrogel-based and other contact-lens systems, but future trial completion dates mean those results still need to be read after publication.
Implementation also includes daily life. Athletes may train before dawn, sleep irregularly during travel, or compete under lighting conditions that shift circadian patterns. Research in rats reported in 2026 suggested that eye pressure follows a daily rhythm and that constant light disrupted that rhythm in that model. Animal data cannot be directly translated into athlete advice, but they support the broader biological point that light-dark timing and IOP regulation deserve careful study. For broader science context across the same publishing network, see Harvard Science Review.
Athlete Relevance For wireless IOP monitoring
Where Sports Vision Fits
For athletes with diagnosed glaucoma, ocular hypertension, strong family history, high myopia, prior eye trauma, or suspicious optic nerve findings, daily pressure rhythm research may be worth discussing with an ophthalmologist. The question is not whether an athlete is fit or visually skilled. The question is whether their optic nerve risk profile warrants more detailed pressure assessment than routine daytime readings can provide.
Wireless IOP monitoring may also help clinicians ask better questions about timing. If early-morning peaks are common in a glaucoma population, a single afternoon clinic value may not reflect the highest daily load on the optic nerve. For an athlete, that could be relevant when appointments are scheduled around training, travel, and recovery. Still, no study in the research record proves that changing training time, sleep timing, or competition routines based on sensor data prevents glaucoma progression.
Careful Takeaways For Athletes
The safest interpretation is cautious and evidence-based:
- Daily IOP rhythms can include early-morning peaks that routine office visits may miss.
- Peaks and fluctuations appear clinically relevant in glaucoma research, but evidence varies by device and study size.
- Cost-effectiveness depends on meaningful progression reduction, device pricing, and health-system thresholds.
- Athletes should not use pressure rhythm data as a substitute for optic nerve imaging, visual field testing, and specialist evaluation when indicated.
For sports vision science, the value of this research is not hype. It is a reminder that the eye is dynamic across the day. Pressure, structure, and function need to be interpreted together. As of October 5, 2026, the best-supported use of these technologies remains targeted glaucoma research and selected clinical monitoring, not broad athletic screening. The next test for the field is whether more complete pressure data can be turned into decisions that measurably protect vision without adding unnecessary cost, anxiety, or procedures.