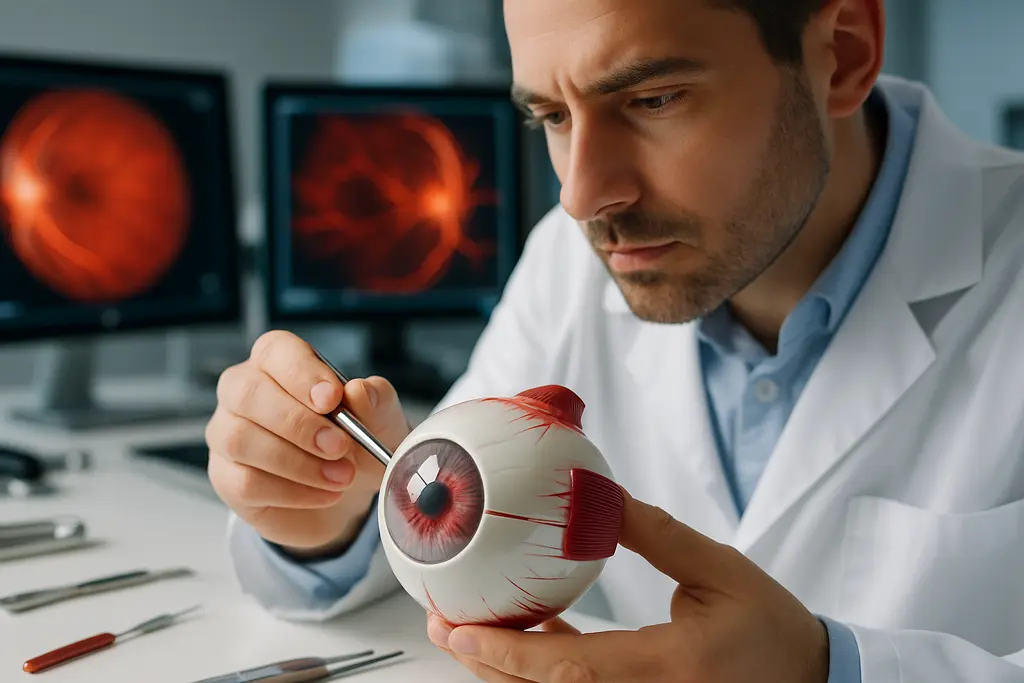
Stuart Gardiner’s new Retinal Blood Flow work asks a focused question: how do retinal vessels and blood flow respond when the eye is exposed to visual stimulation, and could that response help track glaucoma progression? The project, supported for July 1, 2026 through June 30, 2028, is active as of October 8, 2026. It is best read as early translational research, not as a clinical test that athletes or patients can use on its own.
From a sports vision science perspective, the interest is not that this work changes training decisions today. It does not. The value is more measured: athletes with glaucoma or suspected glaucoma often depend on stable visual function under changing visual demands. A repeatable way to measure vascular response to visual stimuli could, if validated, add another layer to monitoring beyond structure and visual field testing.
Retinal Blood Flow As A Glaucoma Signal
Why Retinal Blood Flow Responds To Stimuli
The core concept is neurovascular coupling. In simple terms, active retinal tissue needs a matched vascular response. When visual stimulation increases neural activity, healthy retinal vessels typically adjust diameter and flow. In glaucoma, the concern is that this response may be altered. Gardiner’s 2026-2028 project is designed to compare two measurement approaches: changes in retinal arterial diameter and changes in blood flow.
This distinction matters. Vessel diameter is easier to understand visually, but diameter alone does not fully describe flow. Flow can change with vessel size, velocity, pulsatility, and local resistance. A clinically useful protocol would need to be repeatable, sensitive to disease status, and practical enough for future use outside a specialized research setting. That is a high bar.
What The 2019 Study Added
Earlier work by Gardiner and colleagues gives a reason for caution and interest. In a 2019 study of early primary open-angle glaucoma, optic nerve head capillary flow measured by laser speckle flowgraphy was higher in glaucoma-suspect or fellow eyes without visual field loss than in healthy control eyes. The reported mean values were 16.4 units in suspect or fellow eyes and 12.5 units in controls, with P < 0.0001. Eyes with functional loss measured 13.8 units, still higher than controls but lower than suspect eyes, according to the 2019 optic nerve head flow study.
That pattern does not prove a single mechanism. It suggests that vascular behavior may shift before, during, or alongside functional loss. The same study also reported changes in the pulsatile waveform of optic nerve head blood flow, including delayed deceleration approaching peak flow during the cardiac cycle. Retinal Blood Flow can rise, fall, or change timing in ways that may not map neatly onto a simple “more is better” or “less is worse” framework.
What Gardiner’s Retinal Blood Flow Grant Is Testing
Methods Under Comparison
The current BrightFocus Foundation grant, Grant ID G2026007S, awarded $149,910 for the project titled Measuring the Effects of Visual Stimuli on Retinal Blood Vessels and Flow. The planned methods include video scanning laser ophthalmoscopy, OCT angiography, laser speckle flowgraphy, and mapping biomechanical strain. Each method captures a different part of the response.
Video scanning laser ophthalmoscopy can help assess vessel diameter changes during stimulation. OCT angiography can image vascular patterns without dye injection. Laser speckle flowgraphy estimates blood flow-related signals, including pulsatile features. Strain mapping adds a mechanical context, since the optic nerve head and surrounding tissues are not static structures. The scientific challenge is to decide which measure, or combination of measures, is consistent enough to follow over time.
Why Repeatability Is The First Barrier
A biomarker is useful only if the signal can be separated from noise. Eye movement, fixation stability, vessel segmentation, image quality, blood pressure variation, scan placement, and stimulus design can all influence results. In athletes, testing conditions add another layer: hydration status, recent exertion, and fatigue may affect ocular or systemic physiology, though this specific grant is not presented as a sports-performance study.
The project’s stated goal is to optimize a repeatable and clinically translatable protocol to capture the retinal response to visual stimulation. That wording is careful. It means the work is still being developed and compared. It does not mean clinicians should replace established glaucoma monitoring with stimulus-response vascular testing. For a deeper dive and related research in this network, visit SGTT for more science and health updates.
Evidence From Earlier Blood Flow Studies
Superior And Inferior Vascular Differences
A separate 2024 Gardiner study adds another relevant point: vascular behavior differs by optic nerve head region, even in healthy eyes. The study reported that resistivity index in superior optic nerve head vessels was about 10% higher than in inferior vessels, while tissue within the optic nerve head showed about an 8% superior increase. Pulsatility index was also about 12% higher superiorly in vessels and about 10% higher in tissue, as reported in the 2024 vascular resistance paper.
This matters because glaucoma damage often has regional patterns. If vascular resistance and pulsatility differ by region at baseline, researchers must be careful when interpreting change. A superior-inferior difference might be normal physiology in one context and a disease-relevant signal in another. Good study design has to account for that before claiming predictive value.
Flicker Stimulation And Coupling
Older flicker-light stimulation studies reported that healthy eyes typically show retinal vessel dilation during visual stimulation, while glaucoma eyes can show diminished flicker-induced vasodilation, especially in veins. One reported early open-angle glaucoma comparison included 31 glaucoma eyes and 31 healthy controls, with control venous diameter increases of about 1-2% during flicker stimulus periods and a smaller response in glaucoma eyes.
Those findings fit the idea that stimulus-linked vascular response is altered in glaucoma. Still, study size, stimulus type, disease severity, and measurement method all affect interpretation. The new work’s strength is not that it starts from a blank slate. It attempts to organize a repeatable measurement protocol from a set of related but technically demanding observations.
Limits Before Clinical Use
Why A Biomarker Is Not A Diagnosis
Glaucoma diagnosis and monitoring remain clinical tasks that integrate optic nerve appearance, retinal nerve fiber layer measures, visual field testing, eye pressure, risk profile, and clinician judgment. A stimulus-response vascular measure may one day support that process, but the current research does not establish a stand-alone diagnostic rule.
The same caution applies to OCT angiography. Recent work has linked lower peripapillary vessel density with faster visual field progression, and a separate 2026 cohort study reported that OCTA vessel density could detect progression earlier than visual field testing on average, with lower specificity than OCT structural measures. For a cautious review of that evidence stream, see our related discussion of OCTA glaucoma progression.
Implementation Questions
Even if stimulus-response measures prove useful, implementation will not be automatic. Clinics would need standardized visual stimuli, imaging protocols, quality-control rules, repeatability thresholds, and interpretation models. Costs would vary by imaging platform. Training would matter, because small errors in scan alignment or vessel measurement could create misleading change over time.
There is also a biological interpretation problem. A higher blood-flow signal might reflect compensation, altered autoregulation, early stress, or measurement context. A lower response might reflect vascular dysfunction, tissue loss, or reduced metabolic demand. The same number can mean different things depending on disease stage and location.
Retinal Blood Flow And Athlete Vision
What Athletes Can Take From The Research
For athletes, the main message is restraint. Retinal Blood Flow research may help explain why glaucoma is not only a pressure-related disease, but this work has not produced sport-specific screening rules, return-to-play criteria, or performance predictions. An athlete with glaucoma or suspected glaucoma should not interpret vascular imaging results without clinical context.
The relevance is still real. Sport places visual systems under changing light, motion, contrast, and attention demands. A future test that measures how retinal vessels respond to controlled visual stimuli could help clinicians study whether vascular regulation is changing over time. That would be useful only after validation shows that the measure is repeatable, meaningful, and additive to current care.
Gardiner’s active research sits in that middle zone between mechanism and clinical translation. It is not a treatment and not a replacement for standard glaucoma evaluation. Its promise is narrower and more credible: to clarify whether the retina’s vascular response to visual stimulation can become a dependable marker of disease behavior. For glaucoma updates, that is a careful step worth watching through published results rather than hype.