Author: Stephen Salcedo

  • ILM removal and RGC Integration in Glaucoma

    ILM removal and RGC Integration in Glaucoma

    ILM removal is drawing new attention because the internal limiting membrane may act as a physical barrier to transplanted retinal ganglion cells, the neurons lost in glaucoma. The current evidence is promising but early: mouse experiments suggest better survival and partial maturation after enzymatic disruption, while human surgical data from epiretinal membrane care show both safety signals and trade-offs. That matters for athletes, older adults, and anyone who depends on high-level visual performance, but it does not yet make cell replacement a clinical glaucoma therapy.

    The sports comparison is useful. Better equipment can support performance, but it cannot replace biology, coaching, or injury prevention. In the same way, surgical tools, imaging systems, and cell-delivery methods may help transplanted cells reach the right layer, yet they cannot guarantee meaningful visual recovery. The science is moving from barrier recognition toward integration testing, and the gap between those two steps is still wide.

    ILM removal As A Transplant Barrier Test

    Why ILM removal Matters Biologically

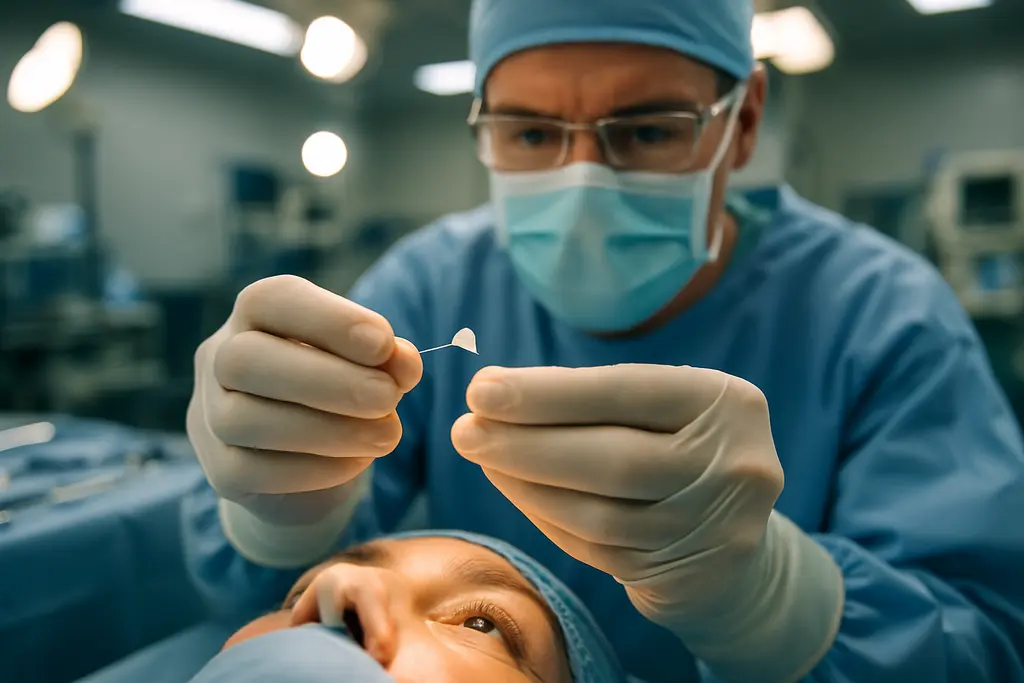
    The internal limiting membrane is the retina’s innermost boundary. For transplanted retinal ganglion cells, it may function like a fence at the edge of the field: cells can survive nearby, but integration into host tissue remains difficult. A 2026 experimental study from the Wilmer Eye Institute at Johns Hopkins tested enzymatic disruption of that barrier using plasmin in mice. The reported optimal dose was about 2.3 micrograms, and transplanted human retinal ganglion cell survival was higher in treated eyes, about 80% compared with about 75% in controls, without reported microglia reactivity or immune infiltration in that model, according to the PubMed record.

    For glaucoma, ILM removal is interesting because retinal ganglion cell replacement would need more than cell survival. A surviving cell still has to mature, extend neurites, form dendrites, connect to retinal circuits, and eventually project visual information in a useful way. The same 2026 work reported that only about 2.0% ± 0.6% of surviving transplanted human retinal ganglion cells in enzyme-treated eyes matured to form dendrites. Mice with patchy, genetically incomplete ILM had a higher figure, about 7.1% ± 1.6%, while controls were near 0.01% ± 0.01%.

    Survival Is Not The Same As Vision

    Those numbers explain both the excitement and the caution. A jump from near-zero maturation to measurable dendrite formation is biologically meaningful. It suggests that the ILM is not just a passive surface but a barrier that can influence transplanted cell behavior. Still, the percentage of cells reaching dendrite formation remained small. No finding in the supplied research establishes restored vision in humans with glaucoma from retinal ganglion cell transplantation.

    This is where precision equipment matters. In sport, a visor or lens tint helps only if it matches the lighting, speed, and task. In retinal repair research, a delivery method helps only if it improves cell placement without causing unacceptable injury. Enzymatic disruption may offer a less mechanical way to alter the retinal surface, but it remains a laboratory strategy in the evidence described here.

    Clinical Safety Signals From ERM Surgery

    Microperimetry And Short-Term Trade-Offs

    Human evidence about the internal limiting membrane mostly comes from surgery for idiopathic epiretinal membrane, not from glaucoma cell replacement. That distinction matters. In the 2024 randomized PEELING clinical trial, 213 patients with idiopathic epiretinal membrane were assigned to active ILM peeling or no peeling and followed for 12 months with OCT, best-corrected visual acuity, and microperimetry. At 1 month after surgery, the peeling group had significantly more new microscotomas, with a reported difference of +3.9 and a 95% confidence interval of 0.8 to 7.0; that difference was not statistically significant at 6 months in the PEELING trial report.

    In surgical clinics, ILM removal has also been associated with lower recurrence of epiretinal membrane in that trial: 0% recurrence in the peeling group versus 19.6% in the no-peeling group at 12 months, with two patients requiring revision surgery. The same research notes reported delayed recovery in best-corrected visual acuity and retinal sensitivity in the peeling group, with lower superior and temporal macular thickness in pericentral sectors at 12 months.

    What Glaucoma Eyes Add To The Question

    Glaucoma changes the risk calculation. The retinal ganglion cell layer and ganglion cell complex are already under disease-related stress, so any added retinal manipulation deserves careful interpretation. A retrospective observational study of 27 eyes, including 5 with glaucoma and 22 controls, followed ganglion cell complex thickness before and up to 6 months after ILM peeling. The research found no significant difference in ganglion cell complex thickness or its thinning rate between glaucoma and non-glaucoma eyes over that short period.

    Longer follow-up paints a more cautious picture. In a study of 231 eyes with coexisting primary open-angle glaucoma and epiretinal membrane followed over 4 years, pars plana vitrectomy with epiretinal membrane removal was associated with greater visual field decline than non-surgical eyes, based on mean deviation and visual field index. The research also reported that adjunctive ILM peeling did not significantly worsen functional or structural outcomes. That suggests the surgery context, glaucoma status, and underlying disease trajectory may matter more than peeling alone.

    • Supported by current evidence: ILM disruption can improve transplanted retinal ganglion cell survival and partial maturation in mice.
    • Not yet supported: routine clinical use of retinal ganglion cell transplantation to restore vision in glaucoma.
    • Still uncertain: how much barrier modification can be done safely in glaucomatous human eyes.
    • Clinically relevant now: OCT, visual field testing, and microperimetry remain key measurement tools when retinal structure and function are being tracked.

    Translation Limits For Glaucoma Therapy

    Integration Requires More Than Placement

    The central translational problem is not simply getting cells into the eye. Integration means that transplanted retinal ganglion cells must survive, mature, extend dendrites, align with local circuits, and contribute to visual signaling. The mouse data show a barrier effect, but the small percentage of dendrite-forming cells shows that the barrier is only one part of the problem.

    A 2026 meta-analysis described in the research notes found that glaucomatous eyes undergoing pars plana vitrectomy with consistent ILM peeling gained a pooled mean of +10.77 ETDRS letters, while studies with variable peeling showed smaller gains. The same analysis reported that glaucomatous eyes gained significantly less vision than non-glaucomatous eyes, with a mean difference of −6.95 ETDRS letters. Those findings fit a practical pattern: eyes with existing optic nerve and retinal ganglion cell damage may have less reserve, even when surgery is technically successful.

    Safety, Cost, And Measurement Barriers

    The implementation barriers are large. Enzymatic disruption would require dose control, delivery accuracy, and safety monitoring. Mechanical peeling already has a surgical track record in epiretinal membrane care, but that does not automatically translate to cell transplantation for glaucoma. Different goal, different risk profile, different patient population.

    Cost and follow-up are also unresolved. If transplanted cells are ever tested clinically for glaucoma, the measurement package would likely need structural imaging, functional testing, and long observation periods. That resembles high-performance sports monitoring: reaction timing, contrast sensitivity, and tracking ability can expose small changes that a basic acuity chart may miss. Readers comparing this work with broader treatment directions can review 2026 glaucoma treatment research for context on drops, implants, lasers, and early neuroprotection concepts.

    Sports Vision Lessons From Retinal Integration
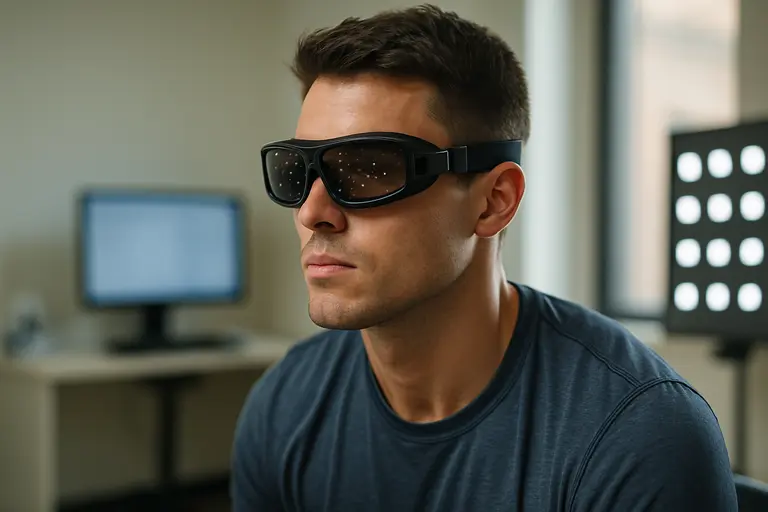
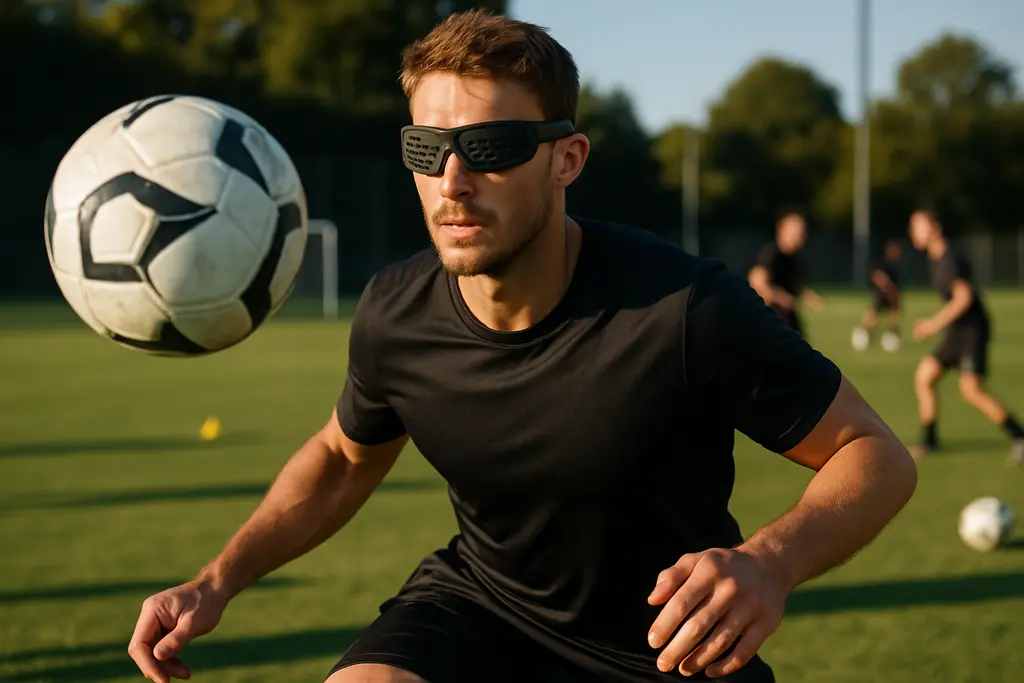
    Athlete wearing protective eyewear during visual performance testing in a clinic

    Equipment Helps Only When The Biology Fits

    In sports vision, better eyewear, shields, sensors, and imaging can support athlete success, but they work inside biological limits. The same principle applies here. A cleaner retinal entry point may help transplanted cells survive or start maturing, yet the retina still has to accept those cells and connect them functionally. That is a much harder standard than short-term survival.

    For athletes with glaucoma or glaucoma risk, the practical message is not to seek experimental procedures. The evidence instead supports careful monitoring and clear communication with eye-care professionals. A basketball guard, a baseball hitter, or a cyclist may notice performance changes before formal testing captures large losses, but symptoms alone cannot identify retinal ganglion cell health. Imaging and field testing remain the more disciplined tools.

    Readers who follow sports vision topics across the same network may recognize Li Live Steam as part of a related site in the same network, focused on performance-oriented coverage. The connection here is the same theme: technology can help athletes and patients only when it is measured against real outcomes, not hope alone.

    ILM removal And RGC Integration In Glaucoma Therapy

    What The Evidence Supports Now

    The current evidence supports a narrow but important statement: ILM removal or disruption can make the retinal surface more permissive to transplanted retinal ganglion cells in experimental settings, and ILM peeling in epiretinal membrane surgery has a documented human safety and efficacy record with specific trade-offs. It does not prove that glaucoma vision loss can be repaired by cell transplantation in patients.

    That puts ILM removal in a research category rather than a treatment category for glaucoma replacement therapy. The most defensible reading is cautious optimism. The barrier is real enough to study seriously, the early biological gains are measurable, and the clinical surgery literature gives researchers a safety framework to examine. Yet functional integration remains limited, and glaucomatous eyes may recover less than non-glaucomatous eyes after retinal surgery. For now, the field has a clearer target, not a finished therapy.
  • Visual Training Tech for Athletic Equipment

    Visual Training Tech for Athletic Equipment

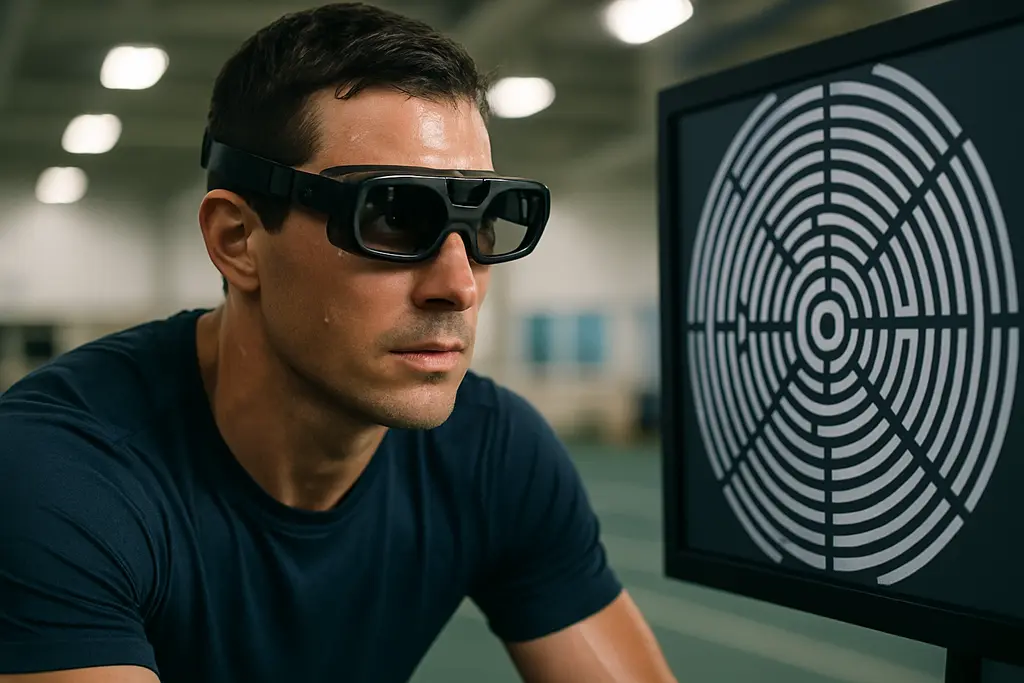
    Visual training tech now sits at a busy intersection of sports equipment, feedback design, and athlete development. The strongest recent evidence supports gains in controlled training tasks, especially reaction, attention, decision timing, and visuomotor skill. The caution is just as clear: athletes may improve partly because they get better at the test itself, not because the new skill carries fully into competition.

    That distinction matters for equipment teams. A light board, headset, tablet dashboard, or sensor-linked display can make practice more measurable. It can also create a closed loop where training and testing look too similar. Stephen Salcedo’s sports-vision lens would frame the question this way: does the device help an athlete read the sport better, or does it help the athlete master the device?

    What Visual Training Tech Evidence Supports

    Visual Training Tech And Learning Effects

    A September 2025 meta-analysis pooled 33 randomized controlled trials with 1,048 participants and found significant improvements across visual attention, reaction time, decision-making time, decision-making accuracy, and eye-hand coordination. Yet the same review reported that when learning-effect bias was controlled by comparing dissimilar training and testing tasks, effect sizes fell sharply: visual attention dropped from SMD 1.65 to 0.07, reaction time from 2.66 to 0.50, and decision-making accuracy from 1.46 to 0.62 digital visual-training review.

    For equipment designers, visual training tech should not be judged only by pre-test to post-test improvement on the same interface. A better product evaluation asks whether the athlete reacts faster, sees relevant cues earlier, or makes cleaner decisions in a task that resembles play but is not simply a repeat of the training screen. This is where sport specificity becomes useful, but only if it avoids becoming a shortcut for test familiarity.

    Where The Signal Looks Stronger

    The signal appears more convincing when drills connect perception to movement. An immersive training meta-analysis registered under PROSPERO CRD420251238825 covered 18 studies and 678 participants. It found moderate beneficial effects on motor competence, including stability and functional mobility near SMD 0.68, object control and visuomotor skills near SMD 0.72, and complex sport-specific skills at SMD 1.15 immersive training meta-analysis.

    Those results do not make headsets or augmented displays automatic upgrades. They suggest that immersive equipment can support practice when visual perception, body control, and task goals are linked. A headset that asks a goalkeeper to read ball flight, body shape, and timing may be closer to sport demand than a generic reaction flash. A basketball light system tied to dribbling, cutting, or passing may have more face validity than a stationary tap test.

    Equipment Design Lessons From Recent Studies

    Feedback Should Coach The Skill, Not The Screen

    A 2026 scoping review in elite sport equipment and feedback systems reported that 81% of studied systems used visual feedback rather than auditory or haptic feedback. That finding fits the direction of the market: graphs, colored targets, light arrays, overlays, and dashboards are common because athletes and coaches can read them quickly. The design risk is clutter. Too much feedback can shift attention away from the opponent, the ball, the lane, or the tactical cue.

    The best use case is not always more data. It may be cleaner timing: a short visual cue, a simple performance trace, or a post-rep comparison that lets the athlete adjust without turning practice into a lab session. This is where sports equipment firms, sensor makers, and manufacturing partners can learn from adjacent design spaces such as Mengo Industries, where material choices and product usability sit close to performance outcomes.

    Light Systems Show Promise, With Limits

    Research notes from a 10-week FITLIGHT technology program with 28 female basketball players reported improvements in visual-motor reaction times and dribbling speed after four sessions per week. Right-hand reaction time improved by about 0.04 seconds, left-hand reaction time by about 0.05 seconds, and reactive dribbling measures improved more than controls. Pre-tests took place on August 4–5, 2024, and post-tests on October 15–16, 2024.

    A separate 8-week youth basketball study published in 2026 also favored FITLIGHT-based training over standard training across reactive agility, bilateral visual reaction time, and dribbling performance. These are useful signals for equipment teams, but they are not enough to claim broad game transfer. The sample sizes, athlete groups, and practice designs matter. A device that helps a player dribble through timed light cues may not fully predict defensive reading, passing choice, or late-game fatigue decisions.

    Equipment FeatureSupported UseCaution
    Light targetsReaction and movement timing drillsMay train response to lights more than play cues
    AR or VR displaysControlled perception-motor practiceTransfer can vary by skill level and task realism
    DashboardsCoach feedback after repetitionsToo much data may distract from sport reading
    Wearable sensorsTiming, head position, or movement contextNeeds validation against sport outcomes

    Transfer, Retention, And Athlete Skill Level

    VR Practice Is Not Always Real-World Practice

    Golf studies in the research set add a useful warning. A Quiet Eye Training intervention with 46 novices, published in August 2025, found that trained golfers improved putting outcomes and visuomotor behavior from baseline to post-test and to 1-week retention. Yet practicing putting in VR without preceding real-world practice did not produce the same retention benefit. Another August 30, 2025 study with 63 golfers found that novices, athletes, and experts holed more putts in the real world than in VR. Experts showed more stable Quiet Eye and radial-error metrics across contexts than less experienced users.

    That does not make visual training tech a poor investment. It means user level matters. A novice may still be organizing basic movement, grip, timing, and target control. If VR changes depth cues, body scaling, or the feel of the action, the novice may learn a version of the task that does not map well to the field. An expert may adapt more easily because the underlying movement pattern is already stable.

    Retention Should Be Built Into Product Testing

    Many equipment evaluations stop too early. If a device improves reaction time after six weeks, the next question is whether the gain remains after one week, one month, or after regular practice replaces the intervention. Retention is not a side issue; it is the difference between a training novelty and a tool that deserves space in a program.

    Coaches can borrow a practical idea from meta-analysis lessons on sports vision training: separate training scores from transfer scores. A useful test battery might include one device-specific score, one sport-like controlled drill, and one coach-rated or video-coded performance measure. None is perfect alone. Together, they reduce the chance of mistaking interface fluency for athletic improvement.

    • Ask what changed: reaction speed, attention, decision accuracy, movement timing, or confidence with the device.
    • Ask where it changed: on the same screen, in a sport-like drill, or during play.
    • Ask how long it lasted: immediate post-test only, short retention, or repeated checks over time.
    • Ask who benefited: novice, youth, college, elite, injured, or high screen-exposure athletes.

    Implementation Barriers For Teams And Makers

    Training room with headsets, sensors, light boards, and coaching notes

    Cost And Setup Need Evidence Discipline

    The research does not settle cost-effectiveness. A team may buy headsets, light systems, displays, sensors, charging stations, and software, then need staff time to run sessions and interpret outputs. Without a clear testing plan, the most visible equipment can absorb budget while producing numbers that do not guide coaching decisions.

    Implementation also depends on safety and fatigue management. A visual drill that adds cognitive load before heavy practice could change how an athlete moves. A headset session that feels realistic may still differ from the speed, body contact, ball flight, or peripheral information of play. The cautious path is short sessions, planned progression, and comparison with normal skill work rather than replacing sport practice wholesale.

    Better Metrics Can Improve Better Products

    For builders, the next generation of equipment should make transfer easier to measure. That means exportable data, clear task settings, repeatable protocols, and options to change the testing task so it is not identical to the training task. For coaches, it means resisting a single score as proof. Reaction time, accuracy, and movement quality should be read together.

    One practical design target is “representative pressure.” The athlete should respond to information that resembles the sport: a defender’s hip, a pitcher’s release, a ball’s spin, or a teammate’s cut. Simple lights can still be useful, especially for warmups or early coordination work, but sport cues should gradually replace abstract cues if the goal is competition transfer.

    Visual Training Tech In Athletic Equipment Decisions

    Visual training tech has earned a place in the equipment conversation, but the evidence favors measured use. Digital visual training can improve several lab and practice outcomes, while learning effects can inflate apparent gains. Immersive tools show moderate benefits for motor competence in pooled studies, yet VR and real-world performance may diverge, especially for less experienced athletes.

    The practical implication is not to reject the gear. It is to buy, build, and coach with sharper questions. Does the device train sport-relevant information? Does it test transfer with a different task? Does it show retention after the novelty fades? Does it fit the athlete’s level and the coach’s plan? Equipment advances can support athlete success when they are treated as instruments, not answers.

  • POAG genetic risk meets deep learning models

    POAG genetic risk meets deep learning models

    POAG genetic risk research has moved from single-marker genetics toward models that combine polygenic scores, ocular measurements, electronic health data, and deep-learning features from eye images. That shift matters because primary open-angle glaucoma can progress quietly, while clinical exams still depend on pressure readings, optic nerve assessment, imaging, and visual field testing. The newer work does not replace eye care. It does, however, show how better equipment, larger datasets, and machine learning may sharpen risk stratification if the tools are validated across real clinical settings.

    For athletes and performance staff, the parallel is familiar: a single metric rarely tells the full story. Sprint timing, workload, reaction speed, and vision tracking each add context. Glaucoma risk models are starting to follow a similar pattern. The science is promising, but the evidence still calls for caution, especially across ancestry groups, imaging devices, and health systems.

    Why POAG Genetic Risk Is Now A Data Problem

    What POAG Genetic Risk Adds To Imaging

    Primary open-angle glaucoma has a genetic component, but the signal is spread across many loci rather than being explained by one simple switch. A 2026 review reported that genome-wide association studies had identified roughly 100 to 127 susceptibility loci for POAG, with pathways converging on trabecular meshwork dysfunction, retinal ganglion cell survival, autophagy and protein homeostasis, neuroinflammation, and extracellular matrix integrity POAG genetics review. That breadth helps explain why polygenic risk scores can be useful but incomplete.

    The practical question is not whether genetics matters. It is how genetic risk should be combined with the equipment already used in eye care. Fundus cameras, OCT scanners, visual field systems, and tonometry each capture different parts of the disease picture. Deep learning can extract imaging features that may be hard for humans to quantify consistently, while polygenic scores summarize inherited susceptibility. The strongest models are now testing whether these streams work better together than alone.

    Why A Single Score Is Not Enough

    A high genetic score should not be read as a diagnosis, and a lower score should not be treated as protection. That is especially true in athletes, where eye findings may intersect with concussion history, contact lens use, refractive correction, lighting conditions, and sport-specific visual demands. The same cautious frame applies to any patient: risk tools can support prioritization, but clinical interpretation still depends on an eye-care professional and longitudinal evidence.

    Deep Learning Evidence From 2026 Cohort Data

    Imaging Features Raised Predictive Performance

    The most direct recent evidence came from a UK Biobank prospective cohort study published in August 2026. Researchers developed machine-learning models to predict 10-year incident glaucoma by integrating deep-learning-derived imaging features from color fundus photographs, polygenic risk scores, ocular measures, and lifestyle or electronic health record variables. In the strictly defined POAG analysis, which included 340 incident cases and 9,374 controls, an XGBoost model reached an AUC of 0.927, with sensitivity of 0.685 at 95% specificity multimodal POAG prediction study.

    The stepwise results are just as important as the headline number. The baseline model using demographic, ocular, and systemic features had an AUC of 0.830. Adding a polygenic risk score raised performance to 0.869. Adding deep-learning-derived imaging features pushed the model to about 0.917. The full multimodal model did not significantly increase AUC beyond the combination of imaging, traditional variables, and genetics, though it improved sensitivity and negative predictive value in the reported analysis.

    What The Results Do And Do Not Show

    That pattern suggests that imaging features carried substantial signal, while POAG genetic risk added meaningful but partial information. It does not prove that such a model is ready for routine screening, nor does it show that using it changes outcomes. AUC is a discrimination measure; it says how well a model separates people who developed disease from those who did not in that dataset. It does not, by itself, solve calibration, referral thresholds, patient anxiety, cost, or follow-up capacity.

    This is where sports vision offers a useful analogy. A high-speed camera can reveal a hitter’s tracking error, but the coaching decision still depends on fatigue, field conditions, equipment fit, and repeat testing. In glaucoma, a model output needs similar context: image quality, optic nerve appearance, intraocular pressure, corneal factors, visual fields, family history, and access to care.

    Equipment, Ancestry, And Workflow Barriers

    Eye imaging device in a clinic room prepared for patient testing

    Better Devices Create Better Inputs

    Deep learning depends on the quality of its inputs. A blurred fundus photograph or poorly centered scan can weaken model reliability. Better cameras, cleaner acquisition protocols, and consistent image grading can help, but they also raise implementation questions. Clinics need trained staff, quality control, data storage, cybersecurity, and time to explain risk results. Large-scale AI is not just a software issue; it is also a hardware and operations issue.

    There is a resource angle as well. Imaging networks, cloud inference, and data governance all need dependable infrastructure. Broader science and infrastructure reporting from Illinois Energy is a reminder of the importance of robust systems in supporting advanced health technology. They provide a crucial backbone including power, cooling, and maintenance, ensuring data-heavy tools can function effectively across different settings. If those costs are ignored, advanced prediction models may stay limited to well-funded centers.

    Ancestry And Generalizability Remain Central

    A key limitation in genetic prediction is transferability across populations. Many genomic datasets have historically overrepresented people of European ancestry, which can reduce performance in other groups. That matters for glaucoma because disease burden and access to specialty care are not evenly distributed. Models that appear strong in one cohort need external validation in diverse populations before they guide broad screening decisions.

    For readers tracking AI vision tools, the same caution applies to image-only systems. Deep learning can show strong performance under controlled conditions, but deployment requires workflow testing, explainability, device compatibility, and careful monitoring for bias. A related discussion of image-based AI limits appears in deep learning glaucoma detection, where the central issue is not whether AI can detect patterns, but whether those patterns hold up safely in practice.

    • Evidence stage: cohort-based prediction research, not a stand-alone diagnostic pathway.
    • Best-supported use: risk stratification research combining imaging, genetics, and clinical variables.
    • Main barriers: ancestry validation, calibration, imaging quality, cost, privacy, and clinical workflow fit.
    • Patient implication: results should support professional assessment, not replace eye exams.

    Deep Learning Advances In POAG Genetic Risk

    The key advance is not that deep learning has solved glaucoma prediction. The better reading is that POAG genetic risk becomes more informative when it is placed beside structured clinical data and imaging features. The August 2026 UK Biobank study showed a clear gain from adding polygenic risk to baseline variables, then a larger gain when deep-learning imaging features entered the model. The 2026 genetics review showed why this makes biological sense: POAG risk spans many loci and several disease pathways, so one measurement is unlikely to capture the full signal.

    For sports-minded readers, the best comparison is a modern performance lab. Good equipment can measure more than the eye can see: small timing changes, subtle tracking errors, or workload trends. In glaucoma research, retinal imaging and genetic scoring are playing that measurement role. Still, better measurement is not the same as proven benefit. Before these models can shape wide clinical policy, researchers need prospective testing, fair validation across ancestry groups, cost analysis, and clear rules for how risk scores change follow-up.

    POAG genetic risk research is advancing because deep learning can convert images into quantitative features and genetics can summarize inherited susceptibility. The cautious takeaway is that multimodal prediction looks stronger than any single input, but responsible use will depend on validation, access, and careful communication with patients.

  • Glaucoma Suspect Monitoring by Risk Level

    Glaucoma Suspect Monitoring by Risk Level

    Glaucoma suspect monitoring is shifting toward a risk-tiered model, closer to how performance teams manage athlete vision: repeat the right test at the right interval, then interpret change against baseline data. For open-angle glaucoma suspects, that means not treating every optic nerve appearance, pressure reading, or borderline field result as the same level of threat. The evidence supports a more careful approach, but it does not support a simple formula that can replace clinical judgment.

    The current research picture is useful because it separates average risk from concentrated risk. A large 2026 U.S. cohort reported a 9.4% conversion rate in the first year after a new suspect label, then an annual conversion rate near 5.3% in years 2 through 5. Within that same research, lower-risk patients under age 50 and not yet treated had an annual conversion near 2.0% after year one, while higher-risk patients over age 70 and already treated as suspects had an annual risk near 16.7%. Those gaps are too wide for a one-size follow-up schedule.

    Why Glaucoma Suspect Monitoring Needs Risk Tiers

    Risk tiers are not a branding exercise. They are a way to avoid two common errors: under-monitoring people who have multiple risk signals, and over-monitoring people whose findings remain stable for years. In sports vision, the same principle appears in equipment testing. A catcher with repeated tracking errors under stadium glare deserves closer evaluation than a recreational runner with a single mild complaint. The tool is not the whole answer; the pattern over time matters.

    For open-angle glaucoma suspects, the “equipment” is clinical measurement: intraocular pressure, optic nerve evaluation, retinal nerve fiber layer imaging, visual field testing, corneal thickness assessment, gonioscopy, and the consistency of results across visits. Research notes from 2025 and 2026 guideline updates emphasize individual risk-based follow-up for optic nerve, OCT/RNFL imaging, and visual field testing. Higher concern is attached to elevated intraocular pressure, thin corneas, disc hemorrhage, large cup-to-disc ratios, and higher pattern standard deviation.

    Glaucoma Suspect Monitoring Signals To Weigh

    The evidence base points to several recurring risk signals, though their meaning varies by study design and population. Older age appears across multiple datasets. Male sex and Black race were associated with increased hazard of conversion in U.S. insurance-claims data, while suspect treatment and having had gonioscopy were also linked with higher conversion. Those last two signals should be read carefully: they may reflect clinician concern and closer surveillance rather than a direct biological cause.

    The All of Us analysis included 5,274 glaucoma suspects and found that 15% converted over 5 years. Conversion was more likely among people identified as African American or Black, older participants, men, those with prior intraocular surgery, and those reporting delays in healthcare access; employment was associated with lower risk in that analysis All of Us glaucoma suspect analysis. These data connect eye risk with access and social context, which matters because missed visits can blur the difference between stable suspicion and documented progression.

    What Population Studies Can And Cannot Prove

    Large datasets are valuable, but they are not clean laboratory experiments. Insurance claims can be influenced by coding practices, visit frequency, diagnostic caution, and referral pathways. A person who receives more testing may be more likely to receive a formal diagnosis, even if the underlying disease process is not faster. That does not make the data useless; it means clinicians and researchers should avoid overstating cause from association.

    Population differences also matter. A Korean nationwide cohort of 32,220 glaucoma suspects found that 4.92% converted to primary open-angle glaucoma over 6 years. Diabetes, hypertension, dyslipidemia, and coronary heart disease were reported as independent risk factors in that study Korean nationwide cohort study. This does not mean those conditions diagnose glaucoma, and it does not mean changing systemic disease status will by itself prevent conversion. It does suggest that systemic health data may help refine risk discussions.

    Evidence From High-Risk And Lower-Risk Groups

    Risk-stratified care becomes clearer when the absolute numbers are placed side by side. In a 2026 Singapore tertiary-care cohort of 101 suspects followed for 5 years, about 25.6% converted. Predictors included age over 75 years, intraocular pressure of 22–24 mmHg, intraocular pressure above 24 mmHg, and family history of glaucoma. That was a tertiary eye-center group, so it may not match the risk level seen in broader community populations.

    Another cohort of 330 glaucoma suspects of African ancestry, followed for a median of about 6.7 years, reported 13.6% conversion. Elevated intraocular pressure at or above 21 mmHg and myopia at or below –0.5 diopters were associated with higher risk. The same research notes reported that absence of systemic hypertension was associated with increased risk, a finding that should be treated cautiously because it may not generalize across populations or care systems.

    These studies do not compete as if only one is right. They show why clinic setting, ancestry, age distribution, baseline intraocular pressure, referral pattern, and testing frequency can change the apparent risk. A suspect in a tertiary referral clinic is not automatically comparable to a newly coded suspect in a national claims dataset.

    Practical Risk Bands For Follow-Up Discussions

    A cautious framework can group suspects into lower, intermediate, and higher concern, while leaving final decisions to clinicians. Lower concern may include younger patients with stable optic discs, stable visual fields, and no repeated pressure elevation. Intermediate concern may include one or more risk signals that are present but not clearly worsening. Higher concern may include older age, repeated higher intraocular pressure, thin corneas, suspicious disc change, disc hemorrhage, family history, or unstable field/OCT findings.

    • Lower concern: stable pressure, disc, imaging, and fields across several visits, with no major risk cluster.
    • Intermediate concern: mixed findings, uncertain test reliability, or systemic and social factors that may affect follow-up.
    • Higher concern: multiple risk signals, suspicious structural change, higher pressure, or documented functional concern.

    Swedish guidance published in January 2024, as described in the research notes, suggested follow-ups every 6–12 months initially for ocular hypertension and glaucoma suspects, with possible extension to every 1–2 years for stable ocular hypertension and possible extension or discontinuation for suspects whose pressure, disc, and fields remain unchanged for several years. That is not a universal rule, but it illustrates how stability can alter monitoring intensity.

    Testing Tools, Cost, And Implementation Barriers

    OCT scanner and visual field equipment prepared for clinic testing

    Glaucoma suspect monitoring depends on repeatable measurements, not one dramatic test. OCT can help track retinal nerve fiber layer and optic nerve structure. Visual field testing can help detect functional loss. Intraocular pressure remains a key metric, but pressure alone is not enough. Like sensor data in elite training, each metric gains meaning when it is repeated under consistent conditions and compared with prior performance.

    Implementation is harder than the concept. More frequent review can detect change earlier, but it can also raise cost, clinic workload, patient anxiety, and false alarms from noisy tests. Less frequent review reduces burden, but it may delay recognition in people whose risk is higher than first assumed. Research notes on referral-clinic economic modeling found that a less stringent review strategy, triggered after one risk factor rather than three, could be more cost-effective per glaucoma diagnosis because it identified glaucoma sooner and discharged low-risk patients earlier. That trade-off is clinic-specific and depends on access, testing capacity, and patient follow-through.

    For clinicians and patients seeking a related site discussion, this risk-level monitoring framework connects these ideas with practical visit planning. Additionally, if you’re interested in broader science and sports coverage within the same network, lilivesteam.org offers related content and discussions.

    Glaucoma Suspect Monitoring For Open-Angle Risk

    The strongest case for risk stratification is not that it predicts every outcome. It is that glaucoma suspect monitoring can match surveillance intensity to measured concern, while staying honest about uncertainty. A newly labeled suspect with stable findings does not carry the same evidence profile as an older patient with repeated pressure elevation, suspicious structural change, and unreliable access to follow-up.

    For glaucoma suspect monitoring to work well, baseline quality matters. A weak visual field test, poor OCT signal, or single pressure reading can create confusion. Repeat testing may clarify whether the signal is real, but repeated testing also consumes time and resources. That is where risk tiering earns its value: it helps decide who needs closer observation, who may be safely spaced out, and who needs reassessment because the data are too inconsistent to trust.

    The evidence supports a cautious middle path. Risk-based follow-up is more defensible than fixed-interval monitoring for everyone, but it should not be presented as a stand-alone prediction engine. Open-angle glaucoma suspects are heterogeneous. Age, pressure, optic nerve findings, visual field stability, systemic health, ancestry, family history, and healthcare access all shape the monitoring plan. The science is strong enough to guide stratification, but not so settled that it can replace individualized eye care.

  • ASP2767 gene therapy Glaucoma Trial Signals

    ASP2767 gene therapy Glaucoma Trial Signals

    ASP2767 gene therapy has moved from preclinical promise into a Phase 1/2 glaucoma trial, and that shift matters because glaucoma care still depends largely on lowering intraocular pressure. The new study does not prove benefit yet. It does, however, give researchers a structured way to test whether a neuroprotective approach can be delivered safely to eyes with moderate to advanced open-angle glaucoma.

    For readers who follow sports vision, the logic is familiar: performance equipment is judged by controlled testing, not marketing. A visor, lens tint, or tracking system is useful only if it protects visual function without adding unacceptable tradeoffs. The same disciplined lens should apply here. An investigational injection aimed at optic nerve protection must first clear safety, dosing, and measurement questions before anyone can call it a future treatment option.

    The ASP2767 trial was listed as an interventional Phase 1/2 study in open-angle glaucoma, assessing safety, tolerability, and efficacy in people with glaucoma-related optic nerve damage through the official Astellas registry trial record. That is a meaningful research milestone, but it is still early-stage clinical science.

    What ASP2767 Gene Therapy Is Testing

    From Eye Pressure To Optic Nerve Protection

    Standard glaucoma management focuses on intraocular pressure, or IOP. Drops, lasers, and surgery are used to reduce pressure-related stress on the optic nerve. The research question behind this program is different: can a gene-based approach support retinal ganglion cell survival in eyes already showing optic nerve damage?

    That distinction is the reason the trial has drawn attention. The inclusion criteria described in the registry require IOP to be 21 mmHg or lower under current therapy, or otherwise well controlled. In other words, this is not simply a pressure-lowering experiment. It is studying people whose disease burden includes visual field loss and optic nerve damage despite pressure management.

    The study criteria separate disease severity across phases. Phase 1 includes participants with mean deviation between -12 and -20 dB. Phase 2 includes moderate to advanced open-angle glaucoma, defined as mean deviation between -6 and -20 dB. Those numbers matter because visual field change is slow, variable, and difficult to measure, especially in advanced disease.

    ASP2767 Gene Therapy Trial Design

    The design has two distinct parts. Phase 1 is open-label dose escalation, with small cohorts receiving increasing doses to help determine the highest safe dose. Phase 2 is randomized, double-masked, and sham-controlled, comparing a high dose, a lower dose, and a sham injection. That design is stronger than an uncontrolled case series because it can separate treatment signal from testing noise, expectation effects, and natural variation.

    ASP2767 is administered as a single intravitreal injection into one study eye. The trial also includes prophylactic regimens A and B to reduce the risk of inflammation after injection. That detail deserves attention because ocular inflammation is not a minor implementation issue for intravitreal gene delivery. If inflammation proves frequent, prolonged, or hard to manage, the path toward clinical use would become much harder.

    Enrollment, Dates, And Outcome Measures

    What The Timeline Can And Cannot Tell Us

    The study launched on August 14, 2026, with the first participant enrolled that day. The enrollment target is approximately 156 adults aged 18 or older with moderate to advanced open-angle glaucoma and optic nerve damage, with a primary completion date listed as July 31, 2030 in a trial summary registry listing. As of September 21, 2026, that places the project near its opening phase, not near a results readout.

    Each participant is followed for about 52 weeks after treatment. Outcome assessments include adverse events, best-corrected visual acuity, ophthalmic imaging with OCT, and visual field mean deviation. These are familiar tools in glaucoma research, but none is perfect. Visual fields can fluctuate. OCT measurements can be influenced by disease stage and image quality. Safety signals may also require longer observation than a one-year primary window can provide.

    The known U.S. site listed in the research summary is Ophthalmic Consultants of Boston and Boston Eye Surgery & Laser Center in Boston, Massachusetts. Site experience can affect surgical consistency, imaging quality, and follow-up discipline, though the public summary does not yet provide results by site, subgroup, or dose.

    Why Sham Control Matters

    A sham-controlled Phase 2 design is especially relevant in glaucoma because endpoints can be noisy. A person may test better on a visual field simply by learning the test. A short-term change may look encouraging without representing true preservation of nerve tissue. Masking and sham comparison help reduce those interpretive traps.

    Sports technology offers a useful parallel. A new tracking headset might look impressive in a training room, but coaches still ask whether it improves decision timing under match conditions, against a fair comparator, and without visual distraction. In glaucoma research, the comparator and masking are just as central. They help prevent hope from outrunning evidence.

    Why The Neuroprotection Claim Needs Caution

    Preclinical Work Is Not Patient Benefit

    The research background notes that ASP2767 came through Astellas’ August 2018 acquisition of Quethera. The underlying program used recombinant adeno-associated viral vectors, or rAAV vectors, to deliver genes to retinal ganglion cells in models of optic nerve injury and elevated intraocular pressure. That preclinical rationale is scientifically plausible, but animal and laboratory models cannot establish patient benefit on their own.

    If ASP2767 gene therapy slows field loss in treated eyes, it could support a pressure-independent route for glaucoma research. The careful phrasing matters. The trial must still show that any signal is meaningful, reproducible, and safer than the risk it adds. A therapy that helps only a narrow subgroup, or requires heavy inflammation control, would raise different clinical questions than one with broad tolerance and durable effect.

    One open issue is durability beyond 52 weeks. Gene therapy is often discussed as long-acting, but this particular glaucoma trial still needs to show how long any biological or functional effect lasts. A one-year study can detect early safety and efficacy signals; it cannot fully define multi-year protection, retreatment needs, late inflammation, or long-term cost implications.

    What It Does Not Mean Yet

    The trial does not mean lost vision can be restored. The research summary frames the approach around neuroprotection and retinal ganglion cell resilience, not regeneration of already lost visual field. It also does not mean pressure-lowering care becomes unnecessary. The study population has controlled IOP under existing therapy, so any future interpretation would likely involve combination with standard care unless later evidence shows otherwise.

    For related reporting on pressure-independent glaucoma mechanisms, this site has also covered how a new glaucoma mechanism may shift research questions without replacing proven monitoring. For a broader exploration of vision science and technology within the same framework, SGTT offers comprehensive coverage of advancements in the field.

    Barriers Before Clinical Use

    Ophthalmology exam room prepared for imaging and patient follow-up

    Safety, Access, And Measurement

    The most immediate barrier is safety. A single intravitreal injection is familiar in retina care, but gene delivery changes the risk discussion. The study’s use of prophylactic regimens to reduce inflammation shows that immune or inflammatory response is a planned concern, not an afterthought. The public trial record will need to be read carefully for adverse event type, timing, severity, and reversibility when results become available.

    Access and cost are separate barriers. The research notes do not provide pricing, manufacturing capacity, insurance expectations, or clinic workflow requirements. Those gaps are not flaws in an early trial; they are reminders that clinical adoption depends on more than biological success. A future therapy could be scientifically interesting yet difficult to deliver widely if it requires specialized injection protocols, long follow-up, or high cost.

    Measurement is another hard problem. Glaucoma progression can be slow, and people with advanced field loss may show variable test results. A trial must distinguish a real treatment effect from measurement noise. Mean deviation, best-corrected visual acuity, OCT, and adverse event tracking together provide a fuller picture than any single outcome, but interpretation will still require caution.

    • Supported now: the trial is active as an early-stage Phase 1/2 study with defined safety and efficacy measures.
    • Not supported yet: claims that the therapy prevents blindness, restores lost vision, or replaces pressure-lowering treatment.
    • Key future evidence: dose response, inflammation profile, field preservation, OCT stability, and durability beyond one year.

    ASP2767 Gene Therapy In Glaucoma Care

    A Research Signal, Not A Practice Change

    ASP2767 gene therapy should be read as a research signal rather than a practice change. Its most interesting feature is not that it is new; it is that the trial tests a neuroprotective idea in people whose IOP is already controlled. That makes the study relevant to one of glaucoma’s persistent gaps: vision can still worsen even when pressure targets are met.

    The athlete-vision analogy helps keep expectations grounded. Better equipment can protect performance only after it proves that it works under pressure, does not impair reaction, and fits the conditions of use. In glaucoma, the comparable standards are safety, stable visual function, credible masking, meaningful outcomes, and feasible follow-up.

    By July 31, 2030, the primary completion target should provide far more evidence than is available now. Until then, the responsible interpretation is cautious: ASP2767 may help define whether gene-based neuroprotection has a path in glaucoma, but patients and clinicians still need results before treating it as anything more than an investigational therapy.

  • Evaluating ICU eye care in Prone Ventilation

    Evaluating ICU eye care in Prone Ventilation

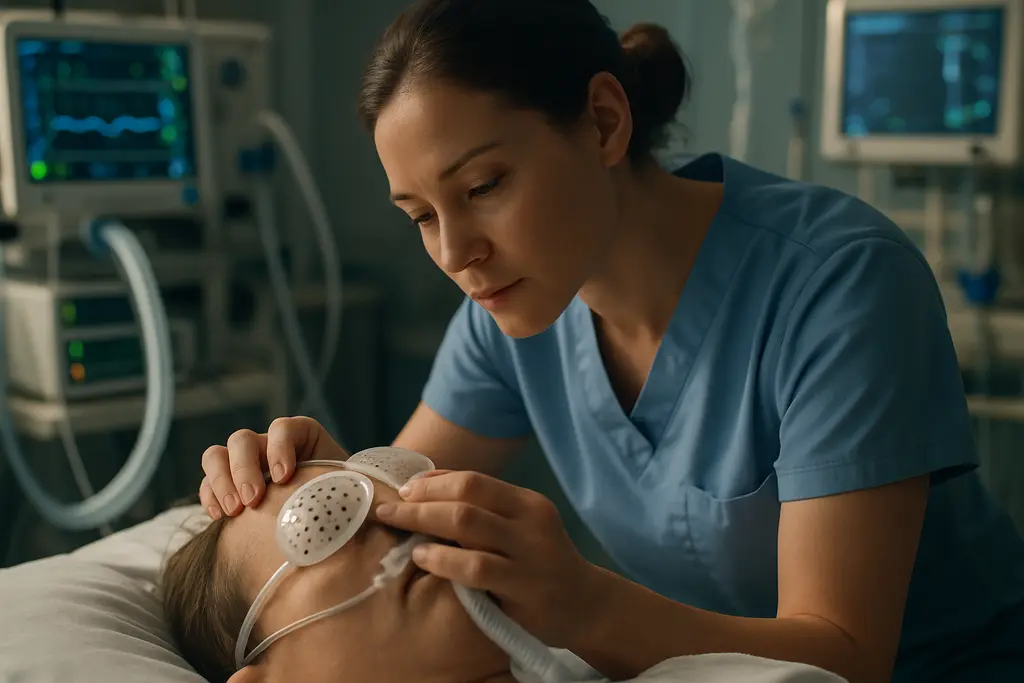
    ICU eye care has become a practical safety question for patients placed in prone position ventilation, not a side issue. Proning can support respiratory management in selected critically ill adults, but the face-down position also changes eyelid exposure, ocular surface moisture, facial pressure, and intraocular pressure patterns. Recent studies from 2024 through 2026 suggested that structured protocols can reduce visible eye injury, yet the same evidence also showed that implementation is fragile under ICU workload.

    The sports parallel is not exact, but it is useful. Athletes rely on visors, padding, lens coatings, and repeatable equipment checks because vision performance can fail under pressure. ICU teams face a more severe version of that problem: patients often cannot report pain, dryness, halos, or blurred vision. Equipment and workflow must carry more of the burden, from head supports and eye protection to documentation prompts and nursing checks.

    What ICU eye care Changed In Prone Ventilation

    ICU eye care Signals In Complication Rates

    A quasi-experimental study in Shanghai, published on August 27, 2026, evaluated a structured eye care plan in 58 ICU patients receiving prone position ventilation. Over one week, ocular complications were reported in 27.6% of the control group and 6.8% of the intervention group. Specific complications also moved in a favorable direction: chemosis fell from 13.8% to 3.4%, exposure keratitis from 6.9% to 3.4%, and corneal injury from 6.9% to 0%.

    Those numbers are clinically meaningful, but the design matters. A quasi-experimental study can show an association between a structured plan and fewer complications, yet it cannot settle every causal question. The sample was small, the observation window was one week, and ICU populations can differ in sedation depth, ventilator settings, fluid status, and illness severity. The most cautious reading is that the protocol looked promising in that setting, not that one protocol has been proven for every ICU.

    Surface Injury And Pressure Findings

    The Shanghai study also reported significantly lower intraocular pressure in the intervention group compared with controls at 8 hours in the prone position and at the end of prone ventilation. That finding matters for glaucoma teams because IOP fluctuation is a familiar risk marker, even if short-term ICU IOP changes should not be translated into a glaucoma diagnosis. The evidence supports monitoring and prevention; it does not support using prone ventilation data alone to label optic nerve disease.

    An August 2026 systematic review included seven studies and 722 critically ill adults under prone position ventilation. It reported frequent findings of chemosis, exposure keratopathy, conjunctival abnormalities, and increased IOP, with risk factors that included lagophthalmos, deeper sedation, higher positive end-expiratory pressure, prolonged or repeated prone sessions, and ocular secretions systematic review. That review helps explain why simple-looking actions, such as checking eyelid closure, are not minor details.

    Outcomes That Matter For Glaucoma Teams

    Why IOP Data Need Caution

    For glaucoma clinicians, the pressure signal is the part of prone ventilation eye care that invites the most attention. The research notes reported increased IOP among prone ventilated patients in the systematic review, while the Shanghai intervention reported lower IOP at measured time points after its protocol was used. Those findings are compatible: prone positioning may be associated with pressure elevation or fluctuation, and an organized plan may reduce some of that burden in a specific ICU workflow.

    Still, ICU pressure readings sit inside a high-noise environment. Sedation, ventilation settings, edema, prone duration, and head position can all affect measurement conditions. A single inpatient IOP value does not explain optic nerve status, visual field status, or future glaucoma risk. For patients already known to have glaucoma or to be glaucoma suspects, the evidence supports clear handoff and risk awareness rather than alarm. Related thinking about risk-stratified glaucoma monitoring can help frame why IOP is only one part of a broader assessment.

    Exposure Keratopathy Is The Near-Term Signal

    The near-term outcome with the clearest ICU relevance is exposure keratopathy. A cross-sectional study conducted between November 2022 and October 2024 in 252 prone ventilation patients observed exposure keratopathy in 51.2% of patients. Reported risk factors included longer prone ventilation duration, higher PEEP, more frequent prone sessions, eyelid insufficiency, and ocular surface secretions. The odds ratios were especially high for repeated prone sessions, eyelid insufficiency, and ocular surface secretions, which points back to bedside checks rather than advanced equipment alone.

    That is where an ICU eye care plan becomes less about ophthalmology as a consult service and more about systems design. If eyelids are not fully closed, if secretions accumulate, or if facial positioning compresses the globe, injury can develop while the patient is unable to complain. The safest interpretation from current evidence is that prevention has to be embedded into routine ICU care, then audited.

    Implementation Barriers Inside The ICU

    Nurse reviewing an electronic ICU record with eye care supplies nearby

    Documentation Does Not Equal Delivery

    A 2024 UK quality improvement initiative used a Plan-Do-Study-Act cycle and integrated an eye care protocol into the ICU electronic patient record. Initial adherence to exposure grading was 2%, then rose to 76% after the intervention UK ICU quality project. That improvement is substantial, yet it also shows the baseline problem: without prompts and ownership, eye exposure grading may be missed in a busy unit.

    Another EMR-based prophylaxis protocol study reported that exposure keratopathy incidence fell from 38.5% to 11.7% after protocol implementation in MICU and NICU settings. The caution is that compliance gaps persisted. Although all patients had prophylaxis ordered, only 53.3% received prophylaxis that was both correctly ordered and administered. That gap is the difference between a plan that exists and a plan that protects patients.

    Equipment, Training, And Workload

    Core measures described in the research included assessing eyelid closure ability, regular eye cleaning or lubrication, avoiding mechanical compression of the eyes, turning the head and eyes every 4 hours, raising the head of bed about 30 degrees, using gel head-rests or protective padding, training staff, and coordinating among ophthalmology, nursing, and ICU teams. These measures are not glamorous. They are closer to a pregame equipment inspection: predictable, repeated, and easy to skip when pressure rises.

    For ICU eye care, equipment quality matters only if the workflow makes its use consistent. Gel supports, protective padding, lubricants, and documentation fields are tools. Their effect depends on staff training, role clarity, supply availability, and whether the electronic record asks the right question at the right time. The same engineering mindset used in sports vision equipment analysis applies here in a more urgent clinical setting: design should reduce the chance that human fatigue becomes patient harm.

    • Evidence stage: field-tested in ICU quality projects and clinical observational studies, but not settled across all hospital settings.
    • Main benefit signal: fewer surface complications in structured protocols, especially exposure-related injury.
    • Main uncertainty: how much IOP reduction, optic nerve protection, and long-term visual benefit can be attributed to any one plan.
    • Main barrier: reliable delivery during sedation, high ventilator demand, prone repositioning, and documentation overload.

    ICU eye care Plan In Prone Ventilation

    How Evaluation Should Be Framed

    Evaluating ICU eye care in prone ventilation should start with outcomes that bedside teams can observe and document: eyelid closure, chemosis, exposure keratopathy, corneal injury, ocular secretions, and IOP when measurement is feasible. It should also track process measures, because complication rates without adherence data can mislead. A unit may adopt a protocol on paper while missing key steps at night, during staffing strain, or during repeated prone cycles.

    The best-supported approach is cautious and practical. Current evidence favors structured assessment, protection from exposure and compression, staff training, and electronic prompts. It does not prove that every patient needs the same intervention, nor does it show that ICU protocols replace ophthalmology review when red flags appear. For glaucoma-focused teams, the message is to treat prone ventilation as a period of increased ocular risk, with IOP considered in context and surface protection treated as an immediate safety target.

    The strongest recent results came from plans that paired simple protective measures with repeatable workflow. That is the key lesson for hospitals: the plan is not just lubricant, padding, or a checkbox. It is the chain that connects risk recognition, equipment placement, nursing action, documentation, escalation, and review. Break one link, and the patient may still be exposed.

  • Neuroretinal Layer Thinning And T1D Control

    Neuroretinal Layer Thinning And T1D Control

    Neuroretinal Layer Thinning in youth with type 1 diabetes is drawing attention because optical coherence tomography, or OCT, can detect small retinal layer differences before many eyes show visible diabetic retinal disease. The evidence does not turn OCT into a stand-alone diagnostic tool for glaucoma or diabetic eye disease. It does suggest that glycemic control may be linked with measurable retinal structure in young people.

    For clinicians, families, and sports vision teams working with young athletes who have type 1 diabetes, the finding matters for a practical reason: the retina is both neural tissue and a performance sensor. Sharp contrast, ball tracking, and fast visual reaction depend on healthy retinal signaling. Current studies do not prove that small OCT differences reduce athletic performance, but they do support careful attention to retinal monitoring in research and clinical care.

    Neuroretinal Layer Thinning And HbA1c Signals

    Why Neuroretinal Layer Thinning Matters

    The strongest recent data in the supplied research came from the ACCESS2 prospective cohort study, published on August 1, 2026. It included 294 youth with type 1 diabetes, ages 9 to 21 years, with a median diabetes duration of 7.0 years. In that cohort, higher HbA₁c was associated with thinner ganglion cell plus inner plexiform layer, or GCL+IPL, and thinner outer retinal layers. The reported difference was 0.39 µm thinner GCL+IPL per 1% higher HbA₁c and 0.81 µm thinner outer retinal layers per 1% higher HbA₁c, according to the study abstract indexed by PubMed.

    Those values are small in everyday terms. A micron is not something an athlete, parent, or coach can see from the sideline. Yet OCT is built to measure retinal layers at that scale. This is where equipment advancement matters: high-resolution imaging can show patterns that a routine visual check may miss. The caution is that a measurable association is not the same as proof that glucose exposure caused each structural change in a specific eye.

    What The Study Population Showed

    The same ACCESS2 data set reported a median HbA₁c of 8.5%, with an interquartile range of 7.5% to 9.9%. Insulin pump use was common, reported in 71.4% of participants. Most eyes did not show diabetic retinal disease: 77.8% had no diabetic retinal disease, 18.8% had mild disease, and 3.4% had moderate disease. That distribution is key because the OCT associations appeared in a population where visible retinal disease was often absent.

    In adjusted analyses, the GCL+IPL and outer retinal associations remained tied to HbA₁c, while diabetes duration and diabetic retinal disease presence or severity did not show the same association in that analysis. That does not mean duration and visible disease are unimportant in broader eye care. It means this specific study found the HbA₁c signal stood out after adjustment.

    What OCT And CGM Added To The Picture

    Layer-Specific Measurements

    OCT breaks the retina into layers rather than treating it as a single sheet. That layer-by-layer view is relevant because type 1 diabetes studies have reported changes in GCL, IPL, retinal nerve fiber layer, central subfield thickness, outer plexiform layer, and outer retinal measurements. The pattern is not identical in every study, which is expected when sample size, age, diabetes duration, imaging platform, and statistical methods differ.

    A separate 2026 longitudinal study described in the research followed 25 pediatric type 1 diabetes patients using insulin pumps and continuous glucose monitoring, compared with 18 controls. Over three years, retinal nerve fiber layer and outer plexiform layer became significantly thinner in the type 1 diabetes group compared with controls. In that small group, glycemic variability was negatively correlated with all inner retinal layers, time in range was positively correlated with the outer plexiform layer, and HbA₁c was not significantly correlated with macular layer thickness. That contrast with ACCESS2 is useful: HbA₁c may be informative, but it may not capture every glucose pattern relevant to retinal tissue.

    Time In Range Signals

    Continuous glucose monitoring added another signal. In ACCESS2, greater time in range, defined as 70 to 180 mg/dL, was associated with thicker outer retinal layers. Youth with HbA₁c at or below 8% had a median time in range near 59%, while those with HbA₁c above 8% had a median time in range near 40%, as reported in the full article available through PMC.

    For technology-minded readers, this is the most interesting equipment story. OCT measures retinal structure; CGM measures glucose exposure over time; insulin pumps represent one delivery method used by many participants. None of these devices, alone, can explain the whole biological picture. Used together in research, they allow investigators to compare retinal anatomy with glucose patterns at a finer scale than clinic HbA₁c alone.

    Why This Is Not A Glaucoma Diagnosis

    Overlap With RNFL And Ganglion Cell Metrics

    Glaucoma specialists pay close attention to the retinal nerve fiber layer and ganglion cell measurements. That creates a natural point of overlap with diabetes-related OCT research. Still, Neuroretinal Layer Thinning in a young person with type 1 diabetes should not be treated as glaucoma by default. The same structural terms can appear in different diseases, and OCT findings require context: optic nerve appearance, intraocular pressure, visual fields, age, refractive status, image quality, and longitudinal change.

    This is why cautious interpretation matters. A diabetes study can identify group-level associations between HbA₁c or CGM metrics and retinal thickness. It cannot tell every patient why a specific scan is thin. Readers interested in how risk framing affects glaucoma monitoring can compare this issue with risk-stratified glaucoma suspect monitoring, where structure is interpreted alongside several clinical variables rather than in isolation.

    Early Signal, Not Settled Screening Policy

    The research also included a large retrospective cross-sectional study published on May 19, 2026, with 1,359 youth younger than 22 years who had type 1 diabetes. In eyes with no diabetic retinopathy, higher HbA₁c was associated with thinner central subfield thickness, GCL, and IPL; after correction for multiple comparisons, central subfield thickness and IPL remained significant. The same study reported that BMI and elevated blood pressure were influential factors. These findings point toward modifiable health variables, but they do not establish a treatment pathway based on OCT thickness alone.

    That distinction matters for families and clinicians. The science supports discussion and follow-up, not self-diagnosis. OCT thinning should be read by qualified eye-care professionals who can decide whether repeat imaging, visual field testing, retinal evaluation, or other assessment is appropriate.

    Implementation Limits For Clinics And Teams

    Sports vision room with imaging device and athlete eye testing setup

    Costs, Access, And Image Quality

    High-resolution OCT and CGM are field-used technologies, not theoretical tools. Even so, access varies. Some pediatric diabetes clinics may not have direct retinal imaging pathways. Some eye clinics may not receive CGM summaries. Image quality can be affected by fixation, motion, segmentation errors, scan protocol, and device differences. In youth and young athletes, cooperation and scheduling can also shape data quality.

    From a sports vision point of view, the best equipment does not replace interpretation. OCT can map retinal layers; it cannot judge visual decision-making under game speed. CGM can show glucose patterns; it cannot by itself determine retinal health. The practical barrier is integration: clinicians need data that are reliable, comparable over time, and interpreted within the patient’s full medical setting. Readers who follow measurement technology across health and infrastructure may also find related network coverage at Illinois Energy useful for understanding the broader context of technological advancements.

    Scale And Evidence Strength

    The evidence base is growing, but it is not uniform. ACCESS2 had a much larger sample than the 25-patient longitudinal study described in the research. The smaller study had the strength of three-year follow-up, but limited scale. Cross-sectional studies can find associations at one point in time, but they are less able to clarify direction or timing. Longitudinal data can help, yet they still need replication across imaging platforms and populations.

    • Supported: Higher HbA₁c was associated with thinner GCL+IPL and outer retinal layers in the 294-participant ACCESS2 cohort.
    • Supported: CGM time in range was linked with thicker outer retinal layers in that study.
    • Uncertain: Whether small OCT differences predict future visual function, sports vision performance, glaucoma risk, or diabetic retinal disease progression in an individual youth.
    • Not supported as a claim: OCT thinning alone should not be used to diagnose glaucoma or prescribe diabetes treatment changes.

    Neuroretinal Layer Thinning In Youth T1D

    What The Evidence Supports Now

    Neuroretinal Layer Thinning in youth with type 1 diabetes appears to be linked with glycemic control in several recent studies, especially where HbA₁c is higher or CGM time in range is lower. The most defensible reading is measured and practical: retinal imaging is picking up early structural signals that deserve attention, but those signals remain part of a broader clinical picture.

    For glaucoma updates, the message is not that diabetes-related thinning equals glaucoma. The message is that retinal neural layers are measurable, vulnerable, and shared across several eye-health questions. OCT, CGM, and insulin delivery data may help researchers identify patterns earlier, but the field still needs larger longitudinal studies to show which changes predict meaningful outcomes. Until then, the responsible path is evidence-based monitoring, careful interpretation, and direct coordination between diabetes care and eye care teams.

  • blue-light filters: What Evidence Shows Now

    blue-light filters: What Evidence Shows Now

    blue-light filters sit in a crowded equipment category: spectacle lenses, tinted clip-ons, blue-blocking glasses, and filtering intraocular lens designs all promise a cleaner relationship with light. For athletes and high-screen users, the appeal is easy to understand. If a lens could reduce visual fatigue, protect sleep, or support sharper evening recovery routines, it would earn a place next to helmets, visors, wearables, and recovery tools. The evidence through 2026 is more restrained. Sleep-related signals exist, especially inside structured light-timing programs, but claims about routine eye-strain relief, visual acuity, or long-term eye protection remain weak or uncertain.

    What blue-light filters Can And Cannot Show

    The strongest data do not support a simple story of “wear the lens and improve everything.” The better reading is conditional: light exposure timing, user age, baseline sleep timing, evening habits, and compliance all shape the outcome. That matters for sports vision decisions because equipment is rarely used in a lab-like setting. Athletes train under stadium lighting, study late, travel across time zones, and recover in rooms with screens and mixed light sources.

    blue-light filters In Sleep Trials

    A June 2026 randomized clinical trial in 86 adolescents, with an average age near 17.5 years, tested a combined plan: sleep scheduling, morning bright-light glasses, and evening blue-light-blocking glasses. Compared with controls, the intervention was associated with a 47-minute increase in weeknight sleep and a 45-minute earlier shift in circadian timing measured by dim-light melatonin onset, according to the adolescent sleep trial. The key equipment lesson is not that the evening glasses worked alone. The trial combined behavioral timing and morning light with the evening lens, so it cannot isolate the filter as the sole cause.

    Why Objective Outcomes Matter

    Other recent trials and reviews described in the research record are less convincing for stand-alone use. In healthy adults, a seven-day randomized comparison of blue-blocking glasses versus clear lenses showed subjective improvements, such as easier sleep onset and fewer awakenings, but no significant objective improvement in total sleep time or actigraphy-measured sleep quality. A 2025 meta-analysis restricted to randomized crossover trials in adults found trend-level improvements in actigraphic sleep onset latency, total sleep time, sleep efficiency, and wake after sleep onset, yet those changes did not reach statistical significance. For teams and buyers, objective measurements matter because perceived rest can improve even when sleep duration, efficiency, or circadian markers do not move clearly.

    Visual Performance And Eye-Strain Claims

    Screen fatigue is where marketing often gets ahead of the evidence. The 2022-2023 Cochrane review summarized in the research notes included 17 randomized trials and 619 adults with follow-up up to five weeks. It found that blue-light filtering spectacle lenses likely produce little to no effect on reducing eyestrain from computer work, while effects on sleep quality remained uncertain. A mid-2026 narrative review reached a similar practical position: no clinically meaningful improvement in visual acuity or digital eye strain symptoms was supported, and routine preventive use was not recommended.

    Evidence For Screens Is Limited

    For athletes, the screen question is not trivial. Film review, travel logistics, online coursework, and late-night communication can extend device exposure well past training. Still, current evidence does not show that filtering lenses are a reliable fix for digital eye strain. A more defensible approach is basic light hygiene: reduce bright artificial light at night, set screens to warmer settings when appropriate, keep the sleep environment dark and quiet, and avoid treating a lens as a substitute for schedule control.

    Color, Contrast, And Sport Equipment Tradeoffs

    Any tint that changes spectral transmission can change how a scene looks. In ball sports, racing, winter sports, and esports, small shifts in contrast or color perception may matter, but the research record says color discrimination and broader visual performance outcomes remain poorly studied. That is a gap, not a green light. Equipment teams should test lenses in the actual lighting conditions athletes face rather than assuming that laboratory comfort or consumer preference predicts performance. For adjacent manufacturing and materials coverage, the industrial insights provided by Mengo Industrial encompass related technology topics connected to the sports-equipment supply chain.

    Timed Light Exposure Versus Passive Filtering

    A central theme in the 2023-2026 evidence is timing. Light is not simply “good” or “bad.” Morning light can support alertness and circadian alignment in some study designs, while late evening bright light can push sleep timing later in susceptible users. A passive filter worn at the wrong time, or without any schedule change, may do little.

    Morning Light Is A Different Tool

    A 2026 randomized trial in people with Parkinson’s disease reported that morning bright light therapy delivered through light glasses improved sleep quality and daytime sleepiness, as described in the light glasses trial. This was not an evening blue-blocking intervention, and it should not be read as advice for unsupervised disease treatment. It does show why timed light exposure may matter more than filtering one band of visible light across all situations.

    Why Timing Changes The Interpretation

    blue-light filters appear more plausible as one part of a controlled evening routine than as all-day protective gear. In the adolescent trial, evening filtering occurred alongside morning bright light and planned sleep scheduling. In adult studies, wearing lenses from about 6 p.m. until bedtime produced signals that were modest and statistically uncertain. That difference should shape product claims. The equipment may help some users manage evening light exposure, but current evidence does not support broad claims that it reliably improves sleep for healthy adults.

    Evidence Snapshot For Coaches And Buyers

    Coach examining eyewear options beside notes and training equipment

    Sports organizations often need practical decisions before the evidence is fully settled. The safest reading is to separate possible uses from unsupported claims. That protects athletes from overpaying for weak promises and protects staff from treating consumer eyewear as a medical or performance intervention.

    What The Evidence Supports

    Claim AreaEvidence SignalPractical Reading
    Evening sleep timingBest signal in multi-component programsConsider only as part of schedule and light management
    Healthy adult sleep durationSmall or non-significant objective effectsDo not promise reliable gains in total sleep time
    Digital eye strainLittle to no effect in higher-level review evidencePrioritize breaks, lighting, and screen habits
    Visual acuity or eye protectionNo strong support for routine preventive useAvoid medical-style claims

    What Remains Unclear

    Several questions remain open. Research is thin on sport-specific tasks such as tracking a fast ball under LED stadium lighting, reading spin against mixed backgrounds, or maintaining contrast perception after travel. Long-term ocular outcomes, macular health, and color discrimination are also poorly studied in the available review evidence. That means a team trial may be reasonable, but it should be framed as local preference and usability testing, not proof of clinical benefit.

    Implementation Barriers In Real Training Settings

    Even a modestly useful lens can fail in practice if athletes dislike the tint, forget the timing, or wear it in settings where it interferes with task demands. The cost question is also practical. Low-cost clear lenses, screen settings, room lighting changes, and consistent bedtimes may address the same target behavior without asking users to adopt a new eyewear habit.

    Fit, Compliance, And Cost Signals

    blue-light filters vary in tint strength, spectral transmission, frame fit, lens quality, and comfort. A darker or more orange lens may block more short-wavelength light, but it may also be less acceptable for reading, walking, or social settings before sleep. Compliance is not a side issue; if the athlete will not wear the glasses at the correct time, the theoretical benefit becomes irrelevant.

    Safety And Practical Limits

    Reported adverse effects in the research notes were generally mild and uncommon, including discomfort, mild headache, and mood changes, with similar events in intervention and control conditions. Still, teams should avoid using consumer lenses to address persistent sleep problems, mood symptoms, headaches, or eye pain without qualified clinical input. The evidence does not justify treating these products as diagnostic tools or therapies.

    Blue-Light Filters State-Of-The-Art Review

    The best 2026 reading is cautious and equipment-specific. For evening routines, filtering lenses may have a place inside a structured plan that also controls bedtime, wake time, room light, and morning light exposure. For computer-related eyestrain, visual sharpness, or long-term eye protection, current evidence does not support confident performance or health claims. Athletes and staff should treat the product category as an optional light-management aid, not as a proven performance enhancer.

    A Cautious Equipment Verdict

    If a team tests these lenses, the test should be simple: define the use window, record sleep timing, track subjective comfort, avoid changing several variables without documentation, and compare against basic light-hygiene steps. That approach respects what the science can show and what it cannot. In sports technology, the best equipment decisions are not the loudest ones; they are the ones that survive measurement.

  • Vision Screening and Return to Play Checklist After Eye Injury

    Vision Screening and Return to Play Checklist After Eye Injury

    Every year, a staggering 40% of eye injuries happen during sports or fun activities, says the American Academy of Ophthalmology. Sadly, over 78% of these injuries occurred without protective eyewear. This is why a thorough post-injury screening is so important.

    Often, the term “return to play” is used without much thought. Athletes might squint at a chart and then get cleared to play. But vision is much more than just a simple switch.

    After an eye injury, the risks are high. Can the athlete track a curveball or spot an opponent without seeing double? We need a strict sideline protocol for a detailed check. It’s not just about avoiding lawsuits; it’s about keeping athletes safe and effective.

    In the next sections, we’ll explore a detailed checklist. It combines clinical data with the real needs of sports. Forget the old “rub some dirt on it” approach; we’re making a guide that’s as thorough as NASA’s.

    For more on eye health in sports, check out this informative resource.

    Why screen vision before clearance safety and performance

    Vision screening is key for athlete readiness, uncovering hidden challenges that can affect performance. An athlete’s vision directly impacts their ability to execute plays and react quickly. Skipping this step can lead to serious consequences for both performance and safety.

    Many think a simple 20/20 vision test is enough. But, reading a static letter “E” from 20 feet away doesn’t show if an athlete can handle fast movements. This is where the illusion of 20/20 plays a role, affecting performance.

    The illusion of 20/20 and the performance tax

    While 20/20 vision is seen as the best, it doesn’t cover the subtleties of visual processing needed in sports. An athlete might see well, but can they track fast-moving objects or judge distances? These are the hidden deficits that can slow performance, often unnoticed until it’s too late.

    Beyond the Snellen chart where hidden deficits lurk

    Research shows that finding oculomotor dysfunction during post-injury screening is key. The CDC Pediatric mTBI Guideline checklist highlights this need. Studies in the Journal of Sport Rehabilitation show that starting rehabilitation quickly can help symptoms resolve faster.

    A UK study found that starting aerobic exercise within 48 hours can reduce symptom duration. This principle also applies to the visual system’s recovery. Letting an athlete “rest” their eyes in a dark room until symptoms vanish is not enough. True safety requires fully integrated neural processing.

    Assessment Type Importance Common Deficits
    Visual Acuity Basic clarity of vision None
    Oculomotor Function Eye movement control Convergence insufficiency
    Depth Perception Judging distances Stereo vision issues

    In conclusion, vision screening is not just a formality; it’s essential for athlete readiness. Understanding the nuances of visual acuity and the impact of hidden deficits helps protect athletes and improve their performance.

    Minimum tests acuity contrast stereo near point convergence pursuits saccades VOR light tolerance

    Think a simple vision test is enough for an athlete? Think again. Vision screening after an eye injury is complex. It involves more than just reading letters on a chart. We start with the basics: static visual acuity and contrast sensitivity.

    Can your athlete see sharpness and shades of gray? Or does everything look like a washed-out Instagram filter?

    Acuity and contrast the static duo

    Visual acuity checks how well one can see. Contrast sensitivity looks at shades. These tests are key. Without them, you miss the big picture.

    Stereo and vergence the 3D partnership

    Then, we look at stereoacuity and near point convergence. This is about depth perception. If your athlete can’t aim their eyes together, they’ll miss the ball.

    Good depth perception helps athletes move around better.

    Oculomotor endurance pursuits saccades and VOR

    Now, we focus on pursuits, saccades, and the vestibulo-ocular reflex (VOR). Pursuits are smooth tracking. Saccades are quick jumps. The VOR keeps your vision steady.

    Shake your head while reading; if the text blurs, your VOR is off. This is key for athletes to return to play.

    Light tolerance the migraine mimic

    Lastly, we talk about light tolerance. Post-injury photophobia is often seen as a “migraine thing.” But it’s a big problem for athletes in bright lights. This isn’t just a checklist; it’s a test of the eye’s strength.

    Test Purpose Indicators
    Visual Acuity Sharpness of vision Ability to see details
    Contrast Sensitivity Shades of gray detection Visual clarity in varying light
    Stereoacuity Depth perception 3D vision capability
    Oculomotor Skills Tracking and focus Quick eye movements
    Light Tolerance Sensitivity to brightness Impact on performance

    A clinical examination room featuring a range of visual acuity and contrast sensitivity tests. In the foreground, a simple eye chart with bold black letters on a white background. To the left, specialized equipment like a contrast sensitivity test chart and a stereo vision test device, neatly arranged. The middle ground includes a professional in business attire, demonstrating the testing processes, with attention to detail on their focused expression. The background is softly blurred medical posters related to eye health, enhancing the clinical atmosphere. The lighting is bright yet soft, casting minimal shadows and creating a clean, sterile environment. The overall mood is serious and methodical, emphasizing precision in vision assessment and recovery after injury.

    Tools charts apps Brock string metronome near point ruler

    When it comes to checking vision, the right tools are key. We’re not talking about expensive lab equipment. Instead, it’s the simple things that work best. The Brock string, for example, is a classic tool that shows how well our eyes work together.

    Prism bars and near point rulers are also important. They find eye problems that fancy machines might miss. In a world full of digital tools, these simple devices remind us of the value of simplicity.

    The Analog Classics

    The Brock string and prism bars are more than just tools. They help us see how well our eyes handle contrast and depth. It’s like using a vinyl record instead of streaming music—it’s old-school but full of detail.

    Prism bars, in particular, help our eyes work together better. They can spot problems that more advanced tools might not catch. With the right person using them, these tools can reveal a lot.

    Digital Allies

    Digital tools like eye-tracking apps and dynamic acuity software are also useful. They measure how well our eyes move with precision. Imagine using software that makes it feel like you’re practicing in a real game situation. That’s what dynamic acuity software does.

    The Metronome as a Cognitive Pacing Device

    The metronome is another tool that helps us understand how our brain works. It makes our eyes move in time, like a drummer. This shows how well our brain can keep a rhythm, even when things get tough.

    Tool Function Advantages
    Brock String Depth perception assessment Simple, effective, reveals eye teaming issues
    Prism Bars Eye alignment testing Uncovers subtle alignment errors
    Eye-Tracking Apps Saccadic precision measurement Quantifies performance with accuracy
    Dynamic Acuity Software Simulates real-world vision challenges Enhances training under pressure
    Metronome Cognitive pacing Improves timing and rhythm in visual tasks

    Pass fail ranges and referral triggers

    Understanding pass/fail ranges in post-injury screening is key. These ranges help decide if an athlete is safe to play again or needs more checks. It’s about finding the right balance between safety and risk.

    The AAPOS vision screening guidelines are clear. Kids aged 36-47 months should spot most shapes on the 20/50 line. Kids aged 5 and up must read at least 20/32. These standards are vital for athletes to see well enough for their sport.

    Quantifying the Unquantifiable

    What about athletes who don’t meet these standards? Here, we use special skills to understand them. For top athletes, a normal eye distance is about 5 cm. If it’s 10 cm, it’s a big warning sign.

    It’s important to compare results to what’s normal and to the athlete’s past performance. If we have that data, it helps a lot.

    Red Flags: When to Hit the Brakes and Pick Up the Phone

    Now, let’s talk about red flags. A dull red reflex means a trip to the eye doctor. A VOR asymmetry that feels like a bad ride? Call the vestibular therapist.

    These signs are not just numbers. They show something is wrong.

    The Asymmetry Alarm: Why a Side-to-Side Difference Matters More Than the Score

    The biggest thing to remember is the asymmetry alarm. An athlete might seem fine, but if one eye is working harder than the other, it’s a problem. It’s not just about the score; it’s about the difference between the two eyes.

    This difference is where injuries often hide. That’s where we need to pay close attention.

    A bright, well-lit indoor medical examination room, showcasing two professionals engaged in a post-injury vision screening. In the foreground, a middle-aged optometrist in a white lab coat is using a vision chart while attentively observing a young athlete sitting across from them, dressed in modest athletic wear. The middle ground features an array of medical equipment such as an eye testing machine and charts on the walls displaying eye health information. In the background, a window lets in natural light, creating a calming atmosphere. The focus should capture the intensity of the exam and the athlete's focused expression, conveying a sense of determination and professionalism. The image should embody a clinical yet supportive mood, emphasizing the importance of proper assessment in the recovery process.

    Progressive exertion add cardio ball tracking decision drills

    When athletes move from a quiet exam room to a bustling field, the stakes get real. It’s not just about passing a vision test; it’s about thriving under pressure. The Iowa return-to-play protocol is a structured approach that emphasizes gradual progression.

    Starting with low-impact exercises, we ramp up to harder aerobic workouts. Then, we move to non-contact sport-specific training, and finish with full-contact practice. This systematic load introduces a vital component: cognitive-motor integration.

    Field-readiness isn’t solely about physical output. It’s also about making quick decisions and maintaining attention amidst chaos. Here’s where the real challenge lies.

    From the Exam Chair to the Treadmill: Introducing Systemic Load

    Passing a vision test in a quiet room is like acing a driving test in an empty parking lot. It proves nothing. To truly assess readiness, we must add cardiovascular load.

    Imagine an athlete on a bike, heart rate elevated, then re-checking the vestibulo-ocular reflex (VOR) and convergence. Does the system break down when the engine is revving? That’s the million-dollar question.

    Sport-Specific Chaos: Catching and Throwing Under Duress

    Next, we introduce sport-specific chaos. Picture this: tracking a ball against a busy background, making split-second decisions—cut left or right?—and executing a motor response. This is the dual-task gauntlet.

    It’s a beautiful, brutal revealer of hidden deficits. An athlete might have perfect saccades when seated, but ask them to call out the color of a tennis ball while shuffling laterally, and suddenly their visual system looks like a buffering YouTube video.

    The Dual-Task Gauntlet: Thinking While Seeing While Moving

    This isn’t just about the eyes; it’s about the cognitive bandwidth to process visual information under physical stress. If they can’t do it here, they’ll default to instinct on the field, and post-injury instinct is often dangerously wrong.

    It’s essential to simulate real-game conditions to ensure athletes are truly ready to return.

    Exercise Phase Description Goals
    Low-Impact Exercise Gentle activities like walking or cycling Increase heart rate without strain
    Aerobic Exercise Moderate-intensity workouts Build endurance and stamina
    Non-Contact Training Sport-specific drills without contact Focus on skill execution
    Full-Contact Practice Incorporating all aspects of the game Assess readiness for competition

    A sports trainer conducting a post-injury screening session in a well-lit gym environment. In the foreground, the trainer, wearing professional athletic gear, is attentively observing a young athlete performing cardio ball tracking decision drills, focusing on their hand-eye coordination and agility. The athlete, dressed in modest athletic clothing, is engaged in a dynamic exercise, evoking a sense of determination and recovery. In the background, exercise equipment and motivational posters related to sports rehabilitation create an encouraging atmosphere. Soft, natural light filters through large windows, casting gentle shadows on the polished wooden floor, highlighting the intensity of the workout and the progressive nature of the training regimen. The overall mood conveys hope and resilience, emphasizing the importance of safe return to play after an eye injury.

    Documentation one page RTP form for coaches ATs and clinicians

    Imagine a world where coaches and clinicians speak the same language—welcome to the RTP form. This one-page document is not just a formality; it’s the Rosetta Stone of sports safety. It translates clinical jargon into clear, actionable signals for coaches and athletic trainers. With this form, you get a binary decision: “Go” or “No Go.”

    The brilliance of this form lies in its clarity. Instead of vague thumbs-ups, it lists specific benchmarks that are essential for safe return to play. Think visual acuity, contrast sensitivity, and convergence stamina—metrics that are more than just numbers; they are the lifeblood of informed decision-making.

    Translating clinical jargon into actionable clearance

    In a world where “cleared” can be a four-letter word in a courtroom, the RTP form serves as a legal shield. It provides the necessary documentation that proves you didn’t just rely on the athlete’s self-reported “I feel fine.” Instead, it showcases a thorough assessment, ensuring everyone is on the same page.

    The legal shield why “cleared” is a four-letter word without data

    Each athlete’s return to play is a journey that should be backed by data. This is where the RTP form shines. It captures critical information like “Passed VOR at 180 bpm heart rate” and “Stereopsis within pre-injury range.” These data points create a narrative of readiness, one that can stand up in court if necessary.

    A shared language for the multi-disciplinary team

    Lastly, the RTP form fosters a shared language among the multi-disciplinary team. The neuro-optometrist, physical therapist, athletic trainer, and coach all see the same data points. This alignment is key for a safe return to play, eliminating any ambiguity that could lead to mishaps.

    Parent communication and athlete education next check date

    Deciding when an athlete can return to play is complex. It’s not just about medical checks. It’s about talking to parents about their child’s safety and future in sports.

    Parents often worry about when their kids can play again. They dream of their children getting scholarships and winning games. This makes the conversation about return-to-play very important.

    We need to use facts to talk to parents. Instead of just saying “their depth perception is off,” we can explain it in detail. For example, “Their brain is seeing a 3D world but with a 2D map. A fast-moving ball will seem to be in two places at once.”

    This approach not only informs but also empowers parents. It helps them understand the challenges their child faces.

    Managing the “When Can They Play?” Pressure with Data

    Being mentally ready is key to getting back to sports. Athletes who are kind to themselves do better in recovery. We must validate their feelings but also stick to the facts about their readiness.

    Being pain-free doesn’t mean they’re ready to play. We need to explain this clearly to them.

    Educating the Athlete on the Difference Between Healed and Ready

    For young athletes, their sport is a big part of who they are. Telling them to wait can be tough. It’s our job to help them understand why they need to wait.

    They need to know the difference between being healed and being ready. This knowledge can help them feel better and follow the recovery plan.

    Setting the Next Check Date: The Safety Net for Lingering Symptoms

    Always make sure an athlete has a “next check date.” This date gives them hope and keeps them safe. It turns a long wait into a plan with a clear end.

    It tells them, “We’re not leaving you out; we’re getting you ready. See you soon.”

    Aspect Importance Action Steps
    Communication Builds trust and understanding Use clear data to explain readiness
    Education Clarifies the difference between healed and ready Discuss neuro-visual functions with athletes
    Follow-Up Provides a timeline for recovery Set and communicate the next check date

    Equipment recheck visor fog glare scratch inspection

    Before we say an athlete is ready, we check their gear carefully. This isn’t just a rule; it’s key to the sideline protocol. Even with perfect vision, a damaged visor can mess up contrast sensitivity.

    A scratched visor doesn’t just blur vision; it scatters light, making everything foggy. Imagine a clear camera picture turning fuzzy. Tiny scratches distort what should be clear. Fog and glare can also ruin a clear view, making a sunny day hard to see.

    The Scratched Visor: A Contrast Sensitivity Assassin

    The visor is your first defense in sports eyewear. If it’s damaged, fogged, or tinted wrong, it can hurt performance. Athletes need sharp vision for quick decisions and safety.

    Fog and Glare: The Environmental Wildcards

    Foggy visors are dangerous. They lower reaction time. Glare can also hide important details. It’s vital to check for these problems often.

    ASTM F803: The Gold Standard You Must Enforce

    The ASTM F803 standard is key. Without it, eyewear is just a costume. It ensures the gear is safe, scratch-resistant, and lets you see all around. Regular glasses aren’t enough for sports.

    In short, checking gear thoroughly is a must. You can’t let an athlete with broken gear play. Remember, most eye injuries in sports are preventable. Make sure athletes wear the right eyewear. For more on sports eye safety, check out this insightful article on why sports eye safety matters.

    Workflows examples abrasion concussion orbital bruise

    In the world of sports, having a clear eye injury protocol is key. It saves time and helps athletes recover faster. We’ll look at three common injuries: corneal abrasion, concussion, and orbital bruise. Each needs a specific approach to keep athletes safe and ensure a smooth transition to treatment.

    The Corneal Abrasion Workflow: Pain Relief and Epithelial Integrity

    Imagine your athlete feeling like there’s sand in their eye. The first step isn’t vision screening; it’s immediate action. Here’s how it works:

    • Immediate Relief: Give pain relief to ease discomfort.
    • Antibiotic Prophylaxis: Use antibiotic drops to prevent infections.
    • Recheck in 24 Hours: Check if the epithelium is healing before vision tests.

    The Concussion Workflow: When the Visual System is the Canary in the Coal Mine

    The visual system often shows the first signs of trouble. The workflow starts with the SCAT5 assessment. Then, it moves to our minimum tests:

    • Convergence Insufficiency: Check if the athlete can focus on near objects.
    • VOR Dysfunction: Test vestibulo-ocular reflex for balance and coordination.
    • Feedback Loop: If a dual-task drill fails, go back to sub-symptom threshold exercises.

    The Orbital Bruise Workflow: Ruling Out the Hidden Fracture

    A black eye might hide a more serious issue. This workflow focuses on one question: is there entrapment? Key steps include:

    • Depth Perception Test: Check if the athlete can judge distances well.
    • Extraocular Motility Check: Make sure all eye movements are normal.
    • CT Scan Referral: If the eye can’t look up, get an imaging scan, not play.

    From the Sideline Protocol to the Specialist: A Seamless Handoff

    Each workflow is a smooth transition from the sideline to the specialist. The first responder’s quick observations prepare the stage for the surgeon. By following these protocols, we protect our athletes and help them return to play safely and quickly.

    Injury Type Initial Assessment Key Steps Follow-Up
    Corneal Abrasion Pain assessment Antibiotics, pain relief Recheck in 24 hours
    Concussion SCAT5 assessment Minimum tests, feedback loop Monitor symptoms
    Orbital Bruise Depth perception check Extraocular motility, CT scan Refer to specialist

    Downloadable checklist and data log templates

    You’ve learned a lot about vision screening and return-to-play rules. Now, it’s time for the practical stuff. This part gives you tools to turn your knowledge into real actions. It’s like a playbook for your sideline protocol, making things clear and efficient.

    The one-page RTP clearance form

    This simple form has all the important details. It checks VOR symmetry, near point convergence, and how well athletes do in tests. It gives a clear yes or no answer that coaches can rely on. It’s all about the facts needed for a safe clearance.

    The athlete data log tracking progress over time

    The athlete data log keeps track of how athletes recover over time. It shows how things change week by week. It helps see if things like convergence or contrast sensitivity are getting better or worse. This log is key for making smart decisions.

    How to use these templates to build a legally defensible and clinically sound protocol

    Using these templates helps you create a strong post-injury screening plan. They protect you from legal problems by showing your decisions are based on solid evidence. Print these forms out and keep them handy. With these tools, you’re not just guessing. You’re making sure athletes are safe and performing well.

  • Stroboscopic Training Soccer Reaction Time Gains

    Stroboscopic Training Soccer Reaction Time Gains

    Stroboscopic Training Soccer sits at the intersection of sports vision science and training equipment design. The idea is simple: stroboscopic eyewear briefly blocks and restores visual input, forcing athletes to act with less continuous visual information. The evidence is not broad enough to call it a proven path to match performance, but recent soccer studies suggest it may improve selected reaction and agility measures when paired with sport-specific drills.

    What Stroboscopic Training Soccer Shows

    The strongest recent soccer-specific evidence comes from a randomized controlled trial published on July 20, 2026. Weng and colleagues studied 36 male collegiate soccer players over six weeks, with three sessions per week. Compared with controls, the stroboscopic group reduced simple motor time by about 7.8 milliseconds, complex reaction speed by 17 milliseconds, with-ball reactive agility by 1.61 seconds, and without-ball reactive agility by 0.72 seconds PubMed trial record.

    Study Design And Population

    That design matters. A randomized controlled intervention gives more useful evidence than a highlight video or a one-day equipment trial. Still, the sample was small, limited to male collegiate players, and measured short-term outcomes after a defined training block. It does not show that every youth, professional, or recreational player will gain the same amount, and it does not prove lasting transfer into competitive matches.

    The study is best read as field-tested evidence under controlled conditions. The training was not a medical treatment, and the results should not be applied to injury recovery or visual disorders without professional guidance. For coaches, the practical point is narrower: intermittent-vision equipment may support reaction drills when the drill closely matches the athlete’s soccer task.

    Stroboscopic Training Soccer And Reaction Metrics

    The detailed report gives a useful sense of scale. In the stroboscopic group, with-ball reactive agility moved from about 62.67 seconds at baseline to about 60.82 seconds after training. Without-ball reactive agility moved from about 52.16 seconds to about 51.04 seconds full text report. Those changes sound modest, but soccer is often decided by narrow timing margins: the first touch after a deflection, the half-step before pressing, or the extra moment needed to read a goalkeeper’s body shape.

    The value of Stroboscopic Training Soccer is not that it makes vision magically sharper. The more defensible explanation is that reduced visual sampling may push athletes to use earlier cues, anticipate movement, and stabilize action plans under partial information. That is a training hypothesis supported by early soccer data, not a universal rule.

    How The Eyewear Changes Soccer Drills

    Stroboscopic glasses work by alternating between clear and opaque lens states. That creates a controlled visual challenge during passing, ball receiving, dribbling, balance, or agility work. The equipment is most relevant when it is not treated as a novelty. A player juggling a ball while vision flickers is doing a different task than a player scanning a defender, receiving under pressure, and deciding where to pass. The second task is closer to the sport.

    Task Specificity Beats Gadget Appeal

    Recent soccer findings point in the same direction: sport-like drills matter. A 2024 warm-up study in male soccer players found benefit in reactive agility involving ball dribbling, including under fatigue, while tasks without ball control did not show the same pattern. A separate 2025 soccer study found a stronger group effect for anticipation than for several other perceptual-cognitive skills. The shared message is cautious but useful: the eyewear seems most defensible when the drill requires real soccer perception and action.

    For Stroboscopic Training Soccer, task design should include the ball, an opponent or changing cue, and a clear outcome. That may mean a goalkeeper reacting to redirected shots, a midfielder receiving passes from varied angles, or a winger dribbling through a pattern that changes on a coach’s signal. The equipment should raise the visual demand without turning the drill into a guessing exercise.

    Equipment Fit And Training Control

    Equipment progress has made this training easier to trial: lighter eyewear, adjustable occlusion rates, and better compatibility with movement drills reduce some practical friction. Yet equipment does not replace coaching judgment. Occlusion settings, session length, fatigue level, and drill difficulty all affect whether the athlete receives a useful stimulus or simply loses technical quality.

    Coaches comparing visual training tools can keep the same standard they use for boots, balls, GPS units, or resistance devices: does the tool improve the work being done, and can the effect be measured? Discussions about related tools in the sports technology network, such as at Mengo Industries, are most insightful when they separate genuine performance support from promotional claims.

    Where Soccer Programs Should Be Cautious

    The recent evidence base is promising but still developing. A 2026 meta-analysis reported positive sport-related effects across 17 studies and 513 participants, with larger effects for visuomotor reaction time and perceptual-cognitive tasks in open-skill sports. Yet pooled results mix sports, protocols, ages, and testing methods. They help describe a research direction, not a settled coaching formula.

    Protocol Differences Matter

    One review recommended relatively short protocols, from one to six weeks, with one to two sessions per week and about 10 minutes per session. Weng’s soccer trial used six weeks with three sessions per week. Another 2026 trial in female college-aged soccer players paired stroboscopic vision training with agility work for 12 weeks and reported large balance improvements, while change-of-direction improvement was similar between the stroboscopic-plus-agility group and agility-only controls.

    This variation is not a flaw by itself, but it makes implementation harder. If one program uses short warm-up exposures and another uses weeks of structured sessions, the results cannot be treated as interchangeable. Training load, player age, sex, competitive level, and baseline skill may all influence the response. Cost is another barrier: eyewear purchases, coach education, and time taken from technical training must be justified by measurable gains.

    Match Transfer Is The Hard Question

    This is where Stroboscopic Training Soccer needs careful reporting. Improved lab or drill metrics do not automatically mean better match decisions. A player may react faster in a controlled agility test and still struggle with tactical spacing, communication, pressure, or fatigue during a full match. Coaches should avoid treating stroboscopic eyewear as a shortcut for game reading.

    A more sound approach is to pair reaction metrics with soccer outcomes. Track first-touch quality, response to deflections, successful pressing triggers, goalkeeper save reactions, or pass choices under pressure. If those measures do not change, the equipment may still be training a narrow skill, but not the one the team needs most. For readers wanting a related evidence review, this site has covered stroboscopic vision training for soccer with the same caution about protocol-specific gains.

    Building A Practical Reaction-Time Plan

    Goalkeeper practicing reaction saves with controlled service in training

    A reasonable soccer plan starts with baseline testing. Record simple reaction time, reactive agility with the ball, reactive agility without the ball, and one or two position-specific measures. Then add stroboscopic work in short blocks, keeping the drill technical enough that the player still performs soccer actions well.

    • Goalkeepers: use controlled shot reactions, redirected balls, passing under pressure, and footwork tasks with clear safety boundaries.
    • Field players: use receiving, scanning, dribbling, and pressing drills that include changing cues rather than fixed patterns.
    • Coaches: compare pre- and post-training data, and stop using the tool if technical quality drops or no relevant measure improves.

    Session design should be conservative. Start with familiar drills and low occlusion demand. Raise difficulty only when movement quality holds. Athletes should not wear the eyewear during uncontrolled contact situations, crowded scrimmages, or any drill where reduced vision raises collision risk. Safety and task quality are part of the evidence standard, not side issues.

    Stroboscopic Training Soccer In Athlete Success

    Stroboscopic Training Soccer is a useful example of how sports equipment can support athlete success without needing hype. The best current evidence suggests short-term gains in reaction-related and soccer-specific agility measures, especially when drills include the ball and realistic cues. The limits are just as clear: small samples, varied protocols, short follow-up, and uncertain match transfer.

    For athletes, the smart use case is targeted work, not constant use. For coaches, the right question is not whether the eyewear looks advanced, but whether it improves a defined soccer behavior that can be measured. If the answer is yes, stroboscopic work may earn a place beside technical repetition, tactical teaching, strength training, and recovery planning. If the answer is no, the equipment should be adjusted, limited, or set aside.