Let’s cut through the fog, shall we? Building a vision screening protocol for your team isn’t about playing optometrist.
It’s about being the savvy gatekeeper who spots the red flags before they become red tape. Think of it like a smoke detector, not a fire investigation.
This toolkit is your guide to a system that catches the obvious and guides the uncertain. It protects everyone involved—without you needing a medical degree.
We’ll blend cold, hard data from the latest studies with street-smart logistics. Why? Because missing a visual issue isn’t just a clinical oversight. It’s a career-derailer.
Ready to stop guessing and start assessing with purpose?
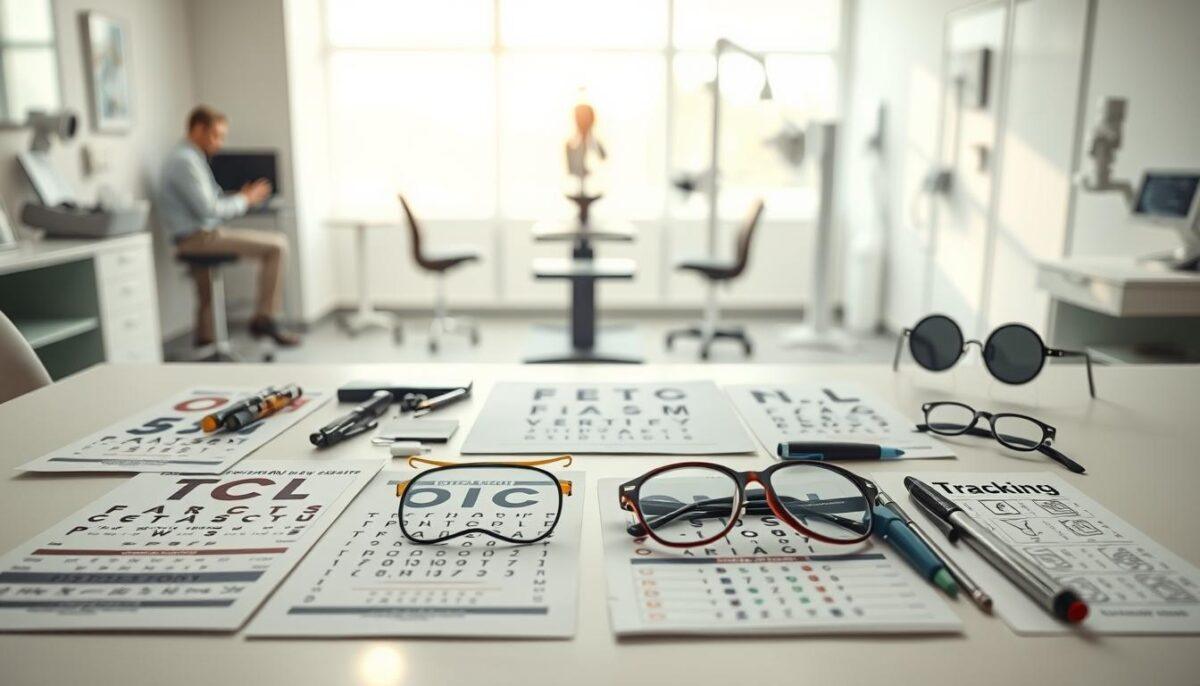
What to Include: Distance and Near Charts, Contrast Checks, Tracking, and Convergence Screens
If you think a vision test is just reading letters from far away, you’re way off. Today’s vision screening toolkit is much more advanced. It checks how well your eyes work in real life, not just at one distance.
Begin with the basics, but make them better. You need charts for both far and near vision. Life is full of close-up tasks, like reading on screens or playing sports. Near point checks help find problems that far charts miss.
Then, test how well you see different shades of gray. This is key for spotting objects in changing light. Contrast charts go beyond simple black and white letters.
Move on to tests that really challenge your eyes. These include tracking moving objects and quick eye movements. A convergence screen checks if your eyes work together well.
Research shows this mix of tests is very effective. Tools like Cambridge Crowded Acuity Cards and photoscreeners catch more issues than one test. For more on these tools, check out these comprehensive assessment kit materials.
Think of it as a detailed vision scan. It’s not just a simple check. It’s a thorough test of your visual abilities before you even start.
Simple Dynamic Tasks: Fixation, Pursuit, and Saccade Timing with a Metronome
Static charts are like theory exams. But dynamic tasks are like the real driving test for the visual system. This part of the vision screening toolkit tests how well you perform in real situations.
We’re checking three key visual skills: fixation, pursuit, and saccades. These are like the main parts of a car engine. If one part doesn’t work, the whole car stutters.

Fixation is like your visual anchor. Can the athlete focus on a single point without wobbling? Or does their eye shake like a bad internet connection? It’s not about willpower. It’s about how well their muscles work together.
Pursuit is smooth tracking. Move a pen slowly back and forth in front of them. Their eyes should follow smoothly, like a camera on a smooth shot. But if their eyes jump around, it’s like a video buffering. This shows how well their eyes work together to track moving targets.
Then, there’s saccades, quick eye movements between two points. Ask them to look back and forth between your hands. Time it with a metronome.
Using a metronome isn’t about being strict. It’s about finding out if their eyes can keep up with a rhythm. If their saccades are slow or off, it’s like their computer is slow.
This focus on dynamic fixation and teamwork isn’t just practice. Tools like the Pediatric Vision Scanner (PVS) measure binocular fixation quality. They help spot strabismus and amblyopia. Research shows that checking how eyes fixate together is key to finding big problems.
These tasks are quick, simple, and very telling. They show not just what an athlete sees, but how their visual system works under pressure. It’s the difference between having a map and knowing how to use it.
Lighting and Distance Setup: How to Avoid Bad Readings
Let’s talk about the silent saboteur of every good screening program: the environment. Your vision screening toolkit is only as reliable as the room you use it in. Think of it this way—you wouldn’t calibrate a race car’s engine with a greasy wrench in a dusty garage. So why trust vision data collected in a subpar setting?
The old computing axiom holds brutal truth here: garbage in, garbage out. You can follow the world’s most elegant protocol to the letter. But if you run it in a dimly lit hallway with glare dancing across the chart, your precious data isn’t just inaccurate. It’s fiction.
Standardization isn’t a suggestion; it’s your new religion. Start with distance. The manual says 3 meters for a reason. This isn’t arbitrary. It’s physics. An inch closer or farther changes the visual angle, skewing the acuity score. Three meters isn’t a ballpark figure; it’s a mandate. Use a tape measure. Mark the floor. Make it ritual.
Then, there’s light. This isn’t about seeing the chart. It’s about seeing it perfectly. You need consistent, bright, shadow-free illumination. Think museum lighting for a priceless painting, not the moody ambiance of a romantic dinner. Shadows create false contrast. Glare induces squinting. Both corrupt the data.
The consequence of a sloppy setup isn’t a minor oops. It’s the difference between identifying a athlete who genuinely needs a specialist and sending someone on a wild goose chase because of a false alarm. That wastes their time, the doctor’s time, and erodes trust in your entire process. This isn’t nitpicking. It’s the foundation of validity.
| Factor | Ideal Setup | Common Pitfall | Impact on Data |
|---|---|---|---|
| Testing Distance | Exactly 3 meters, floor marked | “About” 10 feet, estimated | Alters visual angle, invalidates acuity norms |
| Lighting Quality | Even, shadow-free, ~500 lux | Dim, or single source causing glare | Creates false contrast issues, induces strain |
| Chart Condition | Clean, flat, no reflections | Wrinkled, glossy, or sun-facing | Adds variable difficulty, not pure vision |
| Data Integrity | High. Results reflect true ability. | Low. Results reflect environment. | Leads to erroneous referrals or missed issues |
So, how do you lock this down? Your first defense is your logbook. When a result looks off, your first question must shift from “What’s wrong with the athlete?” to “Was the setup different today?” Meticulously note the lighting and distance in your data logs for every single session. This turns your records from a simple scorecard into a diagnostic tool. Consistent setup is the unsung hero. And detailed data logs are its sworn testimony.
Recording and Privacy: Secure Logs, Baselines, and Change Alerts
Writing down screening results on a napkin is not secure. In the world of athlete health, your data logs are very important. They tell a story that should stay private.
The first screening is like the start of a story. It sets the baseline. Every test after that adds to the story. The real magic is in the change.
A small drop in performance on your contrast charts is important. It’s like a warning light on a dashboard. It shows up before the athlete feels anything. This is why a vision screening toolkit is so valuable.
You need a system to track these changes. Paper files get lost, and shared spreadsheets are a privacy risk. You need secure, digital data logs that are easy to search. This is more than just storing data; it’s creating a living history.

Privacy is key. These results are Protected Health Information (PHI). Treating them lightly is wrong and dangerous. You need a secure system, not a post-it note. Use platforms that follow HIPAA rules, like CognitoForms. For more on setting this up, check out an open-source HIPAA compliance guide.
The best part of a good system is automation. Set up alerts for big changes from a person’s baseline. If their score drops 15%, or their contrast sensitivity changes, you’ll get a notification. This turns your vision screening toolkit into a 24/7 watchful eye. It helps you make quick, informed decisions while keeping the athlete’s story safe.
Referral Criteria: Vision Below Threshold, Persistent Symptoms, or Concussion History
Think of your referral criteria as the tripwire in a heist movie—it’s silent, precise, and when it’s triggered, everyone knows it’s time for the experts.
This isn’t about playing doctor. It’s about triage. Your vision screening toolkit has done its job by flagging an anomaly. Now, you need bright lines, not gray areas.
Let’s start with the hard numbers. The pros, like the American Association for Pediatric Ophthalmology and Strabismus (AAPOS), draw clear thresholds. For a child over four, visual acuity worse than 0.2 logMAR is a call to action. Hyperopia above +3.5 diopters or astigmatism over 1.5 diopters? That’s your tripwire.
One study found 26.5% of screened children had a visual problem. In adults and athletes, that percentage doesn’t magically shrink. The stakes just change shape—from classroom performance to split-second reaction times.
| Test / Signal | Threshold for Referral | Notes / Rationale |
|---|---|---|
| Distance Visual Acuity | > 0.2 logMAR (worse than 20/32) | A clear deficit in resolving detail, the core of functional vision. |
| Significant Refractive Error | Hyperopia > +3.5D | Astigmatism > 1.5D | Indicates a high likelihood of straining the visual system, leading to fatigue and symptoms. |
| Persistent Symptom or History | Headaches, Double Vision, Eyestrain | Concussion History | Symptoms are data. A past concussion is a giant red flag for visual dysfunction, demanding professional referral pathways. |
Which brings us to symptomology. Persistent headaches after screen time? Eyestrain that doesn’t quit? Reports of double vision? These aren’t complaints to note and forget. They are the body’s error messages.
And concussion history? That should make your referral pen twitch. It’s the ultimate signal that the brain’s visual processing software might be glitching, regardless of how the hardware “charts.”
Your protocol must be crystal. Is it a fail on two separate screening tests? Is there an observable eye turn or tracking issue? Document the *why* of the referral as meticulously as the *what*. You’re building a case file, not casting a verdict.
Remember, you are connecting dots on a map that leads to an optometrist or ophthalmologist. You are not diagnosing. This is the elegant purpose of a good screening system: to identify, triage, and route efficiently.
Clear criteria transform anxiety into action. They turn a “maybe” into a definitive next step, protecting long-term vision and performance. It’s how you move from data points to defined referral pathways, ensuring findings don’t just sit in a log but activate a chain of care. For athletes, this often integrates directly with specialized vision training protocols for recovery.
So set your tripwires. Make your map. And don’t be afraid to hand off the compass.
Build Local Care Partnerships: Optometry, Sports Med, and Communication Forms
Creating local care partnerships is more than just paperwork. It’s about building relationships that make your vision screening part of a bigger care plan. Your vision screening toolkit collects data, but it needs a purpose.
Start early. Find the optometrists, ophthalmologists, and sports medicine doctors in your area before your athlete needs a check-up. Learn about their specialties. Who deals with complex vision problems? Who knows about concussion protocols?
Your communication form is like a diplomatic letter. It clearly states: “Here’s what we found, what we did, and why we’re sending them to you.” It’s not just a note. It’s a professional way to pass on information, saving time and showing you’re committed.
Learn from public health. A referral is only a suggestion without follow-up. Your work doesn’t end when you send the form. Create referral pathways and keep them open. A quick call or message to confirm the appointment is key.
This network makes your toolkit’s data useful. A problem can easily go to a specialist for sports vision exams and treatment. You’re not just spotting issues. You’re finding solutions.
Good referral pathways protect athletes’ vision and performance for the long term. They turn your vision screening toolkit into the heart of a responsive, professional care network.
Integrate Results into Training: Tweaks, Position, and Eyewear
A convergence insufficiency on a chart isn’t a diagnosis; it’s the reason your striker keeps missing the open net. This is the analytical payoff of your vision screening toolkit. The data logs you’ve meticulously kept aren’t for filing. They’re for coaching.
Think of it as performance analytics for the human eyeball. Discover a minor convergence issue? That could be why your midfielder loses aerial duels in the box. Spot a subtle tracking lag? You’ve likely found the root of that infamous “fourth-quarter focus fade.” The logs tell the story your athletes can’t articulate.
So, what’s the play? You integrate. You tweak. This is where clinical insight becomes competitive edge. It’s not about major overhauls. It’s about smart, subtle adjustments to stance, visual cues, and gear.
Let’s translate the data. The table below maps common screening findings to their on-field symptoms and, most importantly, to actionable training adjustments.
| Screening Finding | Real-World Impact | Training Integration Tweak |
|---|---|---|
| Convergence Insufficiency | Struggles with close-range tasks; losing headers, fumbling catches. | Incorporate “near-far” rapid focus drills using colored cues. Adjust defensive stance to improve depth perception. |
| Saccadic Delay (Slow Tracking) | Appears to “lose” the ball or opponent in fast transitions. | Use a metronome-paced tracking drill with multiple targets. Simplify peripheral visual cues during complex play installations. |
| Contrast Sensitivity Issue | Poor performance in low light or against busy backgrounds. | Recommend sport-specific tinted lenses (e.g., amber for overcast, vermilion for indoor). Use high-contrast tape on equipment during drills. |
The eyewear piece is critical. It’s not just about protection anymore. It’s about optimization. That same data log might reveal an athlete who needs contrast-enhancing tints for overcast games or anti-glare coatings for indoor arenas. You’re not just stopping a finger poke; you’re upgrading their visual interface.
This is the final step in the logic chain. You’ve screened, you’ve logged, you’ve analyzed. Now you act. By weaving these tweaks into daily reps, you stop patching people up and start optimizing the human hardware they perform on. The vision screening toolkit pays its dividends right here, on the field, in the win column.
Review Cadence: Pre-Season, Mid-Season, Post-Injury, and Post-Travel Blocks
A single screening is like a Polaroid photo; a cadence is a detailed documentary of an athlete’s season. It shows the ups and downs, the slow changes, and the sudden injuries. Without a schedule, you’re just making guesses.
Creating a ruthless cadence makes your vision screening toolkit essential for your team. Let’s look at the four key screening blocks.
Each block answers a different question. The table below is your guide.
| Screening Milestone | Primary Purpose | Key Test Focus | Intelligence Gained |
|---|---|---|---|
| Pre-Season | Establish the sacred baseline. This is your “Chapter 1.” | Full battery: distance/near charts, contrast, tracking, convergence. | Raw, uncontaminated data. This is the athlete’s visual fingerprint. |
| Mid-Season | Check for degradation from cumulative fatigue and stress. | Dynamic fixation and pursuit under timed, metronome-driven pressure. | Identifies who is visually resilient and who is breaking down under the grind. |
| Post-Injury (especialy head) | Non-negotiable re-screening. This is a medical directive, not a suggestion. | Convergence, saccades, and symptom tracking. Compare directly to baseline. | Objective data for return-to-play decisions. Cuts through “I feel fine” bravado. |
| Post-Travel Blocks | Assess the jet lag hangover. It messes with more than sleep cycles. | Reaction timing, contrast sensitivity, and simple pursuit tasks. | Quantifies the “travel tax” on visual processing before a critical game. |
Why be this strict? Look at public health. The Michigan program mandates screenings at specific ages: once between ages 3-5, and in grades 1, 3, 5, 7, and 9. They don’t ask if the kid feels like it. The system triggers the check.
Your cadence should be the same—triggered by events, not the calendar. Fatigue is an event. A concussion is a major event. Crossing time zones is an event. This systematic approach is the only way to catch the slow declines, the ones that mimic “just a slump.”
It also flags the sudden shifts immediately. A drop in dynamic fixation scores post-travel? Now you have data to adjust practice intensity. A convergence failure post-concussion? You’re not waiting for symptoms to become obvious.
This cadence turns screening from a one-off event into a continuous stream of health intelligence. It’s the difference between having a snapshot and directing the entire film. Your vision screening toolkit only becomes strategic when you use it on a schedule.
Safety Wrap-Up: Informed Decisions, Reduce Risky Plays, and Protect Long-Term Vision
Your vision screening toolkit is more than just paperwork. It’s a key tool in a world where missing a detail can change everything. It helps make safer choices.
Looking at a player’s chart can change how they play. If they have trouble tracking, it might change their position. This reduces the risk of accidents caused by unseen problems.
The biggest victory isn’t just about winning games. Early detection can prevent permanent vision loss, as shown by Michigan’s program. Your toolkit keeps your vision safe for years to come.
Use this system to find the best eye care and sports medicine experts. This is how you leave a lasting impact. Your kit ensures you see the game clearly, not just watch it.