Category: Glaucoma Updates

  • Glaucoma Suspect Monitoring by Risk Level

    Glaucoma Suspect Monitoring by Risk Level

    Glaucoma suspect monitoring is shifting toward a risk-tiered model, closer to how performance teams manage athlete vision: repeat the right test at the right interval, then interpret change against baseline data. For open-angle glaucoma suspects, that means not treating every optic nerve appearance, pressure reading, or borderline field result as the same level of threat. The evidence supports a more careful approach, but it does not support a simple formula that can replace clinical judgment.

    The current research picture is useful because it separates average risk from concentrated risk. A large 2026 U.S. cohort reported a 9.4% conversion rate in the first year after a new suspect label, then an annual conversion rate near 5.3% in years 2 through 5. Within that same research, lower-risk patients under age 50 and not yet treated had an annual conversion near 2.0% after year one, while higher-risk patients over age 70 and already treated as suspects had an annual risk near 16.7%. Those gaps are too wide for a one-size follow-up schedule.

    Why Glaucoma Suspect Monitoring Needs Risk Tiers

    Risk tiers are not a branding exercise. They are a way to avoid two common errors: under-monitoring people who have multiple risk signals, and over-monitoring people whose findings remain stable for years. In sports vision, the same principle appears in equipment testing. A catcher with repeated tracking errors under stadium glare deserves closer evaluation than a recreational runner with a single mild complaint. The tool is not the whole answer; the pattern over time matters.

    For open-angle glaucoma suspects, the “equipment” is clinical measurement: intraocular pressure, optic nerve evaluation, retinal nerve fiber layer imaging, visual field testing, corneal thickness assessment, gonioscopy, and the consistency of results across visits. Research notes from 2025 and 2026 guideline updates emphasize individual risk-based follow-up for optic nerve, OCT/RNFL imaging, and visual field testing. Higher concern is attached to elevated intraocular pressure, thin corneas, disc hemorrhage, large cup-to-disc ratios, and higher pattern standard deviation.

    Glaucoma Suspect Monitoring Signals To Weigh

    The evidence base points to several recurring risk signals, though their meaning varies by study design and population. Older age appears across multiple datasets. Male sex and Black race were associated with increased hazard of conversion in U.S. insurance-claims data, while suspect treatment and having had gonioscopy were also linked with higher conversion. Those last two signals should be read carefully: they may reflect clinician concern and closer surveillance rather than a direct biological cause.

    The All of Us analysis included 5,274 glaucoma suspects and found that 15% converted over 5 years. Conversion was more likely among people identified as African American or Black, older participants, men, those with prior intraocular surgery, and those reporting delays in healthcare access; employment was associated with lower risk in that analysis All of Us glaucoma suspect analysis. These data connect eye risk with access and social context, which matters because missed visits can blur the difference between stable suspicion and documented progression.

    What Population Studies Can And Cannot Prove

    Large datasets are valuable, but they are not clean laboratory experiments. Insurance claims can be influenced by coding practices, visit frequency, diagnostic caution, and referral pathways. A person who receives more testing may be more likely to receive a formal diagnosis, even if the underlying disease process is not faster. That does not make the data useless; it means clinicians and researchers should avoid overstating cause from association.

    Population differences also matter. A Korean nationwide cohort of 32,220 glaucoma suspects found that 4.92% converted to primary open-angle glaucoma over 6 years. Diabetes, hypertension, dyslipidemia, and coronary heart disease were reported as independent risk factors in that study Korean nationwide cohort study. This does not mean those conditions diagnose glaucoma, and it does not mean changing systemic disease status will by itself prevent conversion. It does suggest that systemic health data may help refine risk discussions.

    Evidence From High-Risk And Lower-Risk Groups

    Risk-stratified care becomes clearer when the absolute numbers are placed side by side. In a 2026 Singapore tertiary-care cohort of 101 suspects followed for 5 years, about 25.6% converted. Predictors included age over 75 years, intraocular pressure of 22–24 mmHg, intraocular pressure above 24 mmHg, and family history of glaucoma. That was a tertiary eye-center group, so it may not match the risk level seen in broader community populations.

    Another cohort of 330 glaucoma suspects of African ancestry, followed for a median of about 6.7 years, reported 13.6% conversion. Elevated intraocular pressure at or above 21 mmHg and myopia at or below –0.5 diopters were associated with higher risk. The same research notes reported that absence of systemic hypertension was associated with increased risk, a finding that should be treated cautiously because it may not generalize across populations or care systems.

    These studies do not compete as if only one is right. They show why clinic setting, ancestry, age distribution, baseline intraocular pressure, referral pattern, and testing frequency can change the apparent risk. A suspect in a tertiary referral clinic is not automatically comparable to a newly coded suspect in a national claims dataset.

    Practical Risk Bands For Follow-Up Discussions

    A cautious framework can group suspects into lower, intermediate, and higher concern, while leaving final decisions to clinicians. Lower concern may include younger patients with stable optic discs, stable visual fields, and no repeated pressure elevation. Intermediate concern may include one or more risk signals that are present but not clearly worsening. Higher concern may include older age, repeated higher intraocular pressure, thin corneas, suspicious disc change, disc hemorrhage, family history, or unstable field/OCT findings.

    • Lower concern: stable pressure, disc, imaging, and fields across several visits, with no major risk cluster.
    • Intermediate concern: mixed findings, uncertain test reliability, or systemic and social factors that may affect follow-up.
    • Higher concern: multiple risk signals, suspicious structural change, higher pressure, or documented functional concern.

    Swedish guidance published in January 2024, as described in the research notes, suggested follow-ups every 6–12 months initially for ocular hypertension and glaucoma suspects, with possible extension to every 1–2 years for stable ocular hypertension and possible extension or discontinuation for suspects whose pressure, disc, and fields remain unchanged for several years. That is not a universal rule, but it illustrates how stability can alter monitoring intensity.

    Testing Tools, Cost, And Implementation Barriers

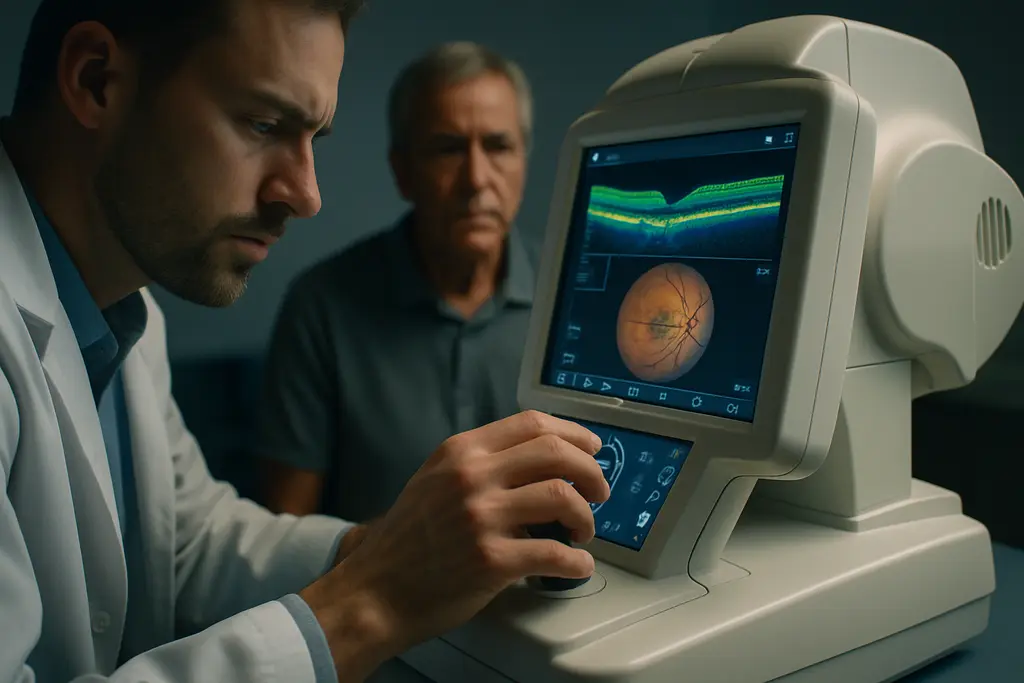
    OCT scanner and visual field equipment prepared for clinic testing

    Glaucoma suspect monitoring depends on repeatable measurements, not one dramatic test. OCT can help track retinal nerve fiber layer and optic nerve structure. Visual field testing can help detect functional loss. Intraocular pressure remains a key metric, but pressure alone is not enough. Like sensor data in elite training, each metric gains meaning when it is repeated under consistent conditions and compared with prior performance.

    Implementation is harder than the concept. More frequent review can detect change earlier, but it can also raise cost, clinic workload, patient anxiety, and false alarms from noisy tests. Less frequent review reduces burden, but it may delay recognition in people whose risk is higher than first assumed. Research notes on referral-clinic economic modeling found that a less stringent review strategy, triggered after one risk factor rather than three, could be more cost-effective per glaucoma diagnosis because it identified glaucoma sooner and discharged low-risk patients earlier. That trade-off is clinic-specific and depends on access, testing capacity, and patient follow-through.

    For clinicians and patients seeking a related site discussion, this risk-level monitoring framework connects these ideas with practical visit planning. Additionally, if you’re interested in broader science and sports coverage within the same network, lilivesteam.org offers related content and discussions.

    Glaucoma Suspect Monitoring For Open-Angle Risk

    The strongest case for risk stratification is not that it predicts every outcome. It is that glaucoma suspect monitoring can match surveillance intensity to measured concern, while staying honest about uncertainty. A newly labeled suspect with stable findings does not carry the same evidence profile as an older patient with repeated pressure elevation, suspicious structural change, and unreliable access to follow-up.

    For glaucoma suspect monitoring to work well, baseline quality matters. A weak visual field test, poor OCT signal, or single pressure reading can create confusion. Repeat testing may clarify whether the signal is real, but repeated testing also consumes time and resources. That is where risk tiering earns its value: it helps decide who needs closer observation, who may be safely spaced out, and who needs reassessment because the data are too inconsistent to trust.

    The evidence supports a cautious middle path. Risk-based follow-up is more defensible than fixed-interval monitoring for everyone, but it should not be presented as a stand-alone prediction engine. Open-angle glaucoma suspects are heterogeneous. Age, pressure, optic nerve findings, visual field stability, systemic health, ancestry, family history, and healthcare access all shape the monitoring plan. The science is strong enough to guide stratification, but not so settled that it can replace individualized eye care.
  • OCTA Glaucoma Detection: Benefits and Limits

    OCTA Glaucoma Detection: Benefits and Limits

    OCTA glaucoma detection has become a serious research topic because it can show vascular changes in the optic nerve head and macula before standard visual field loss is measurable. From a sports vision science perspective, that matters because athletes often depend on contrast, peripheral awareness, rapid target tracking, and confidence in visual stability. The evidence, though, supports OCTA as an adjunctive imaging tool, not a stand-alone diagnosis or a replacement for structural OCT, visual fields, intraocular pressure assessment, and clinical optic nerve evaluation.

    Why OCTA Glaucoma Detection Matters Early

    OCTA Glaucoma Detection Signals Before Field Loss

    Optical coherence tomography angiography measures motion contrast from blood flow to map retinal and optic nerve microvasculature. In glaucoma research, the main interest is whether reduced vessel density can identify early neurovascular change before the patient shows reproducible visual field defects. A study of 79 eyes with pre-perimetric primary open-angle glaucoma and 113 healthy eyes reported lower whole-image peripapillary small-vessel density in pre-perimetric glaucoma, averaging about 49.7% compared with about 53.5% in healthy eyes, with statistically significant differences across most peripapillary regions.

    That finding is meaningful, but it should not be treated as a screening shortcut. Pre-perimetric glaucoma is already a selected clinical category, not the same as an unexamined athletic population. The result suggests OCTA glaucoma detection can capture vascular abnormality in eyes that may not yet show conventional field loss. It does not prove that every athlete with a lower vessel-density value has glaucoma, nor does it define how a single scan should change training, competition, or treatment decisions.

    Regional Patterns Are Part Of The Signal

    The research also points to regional specificity. Vessel-density reduction was not uniform across the eye. Peripapillary and perifoveal regions appear more sensitive in early glaucoma research than central macular or parafoveal regions. In the cited pre-perimetric study, most peripapillary quadrants showed lower all-vessel and small-vessel density, while the temporal quadrant was an exception for peripapillary small-vessel density. This regional pattern matters because a scan report that compresses the result into a single global value can hide localized change.

    For clinicians working with athletes, the regional issue is not academic. A baseball player, cyclist, goalkeeper, or combat-sport athlete may report no obvious visual problem, while early glaucoma risk is being monitored for other reasons. OCTA may add another layer of evidence, but the interpretation still depends on whether the suspicious region matches structural OCT change, optic nerve appearance, and repeatable testing.

    What OCTA Adds To Structural Testing

    Vessel Density Versus Thickness

    The strongest argument for OCTA is not that it outperforms OCT in every early case. The better-supported argument is that it measures a different feature. Structural OCT looks at tissue thickness, including retinal nerve fiber layer and ganglion cell complex measurements. OCTA looks at perfusion-related signals, commonly summarized as vessel density or capillary density. Some recent work summarized in the research notes found that capillary density loss may be more pronounced than retinal nerve fiber layer thinning in pre-perimetric glaucoma and early perimetric primary open-angle glaucoma; about 67% of pre-perimetric eyes in that work had greater vascular than thickness loss.

    This is where OCTA glaucoma detection may be clinically useful: not as a winner over OCT, but as a complementary view. If structure, function, and vascular measures point in the same direction, confidence may rise. If they disagree, the disagreement should trigger review of scan quality, segmentation, ocular media clarity, refractive status, and repeatability before conclusions are drawn.

    Evidence AreaPotential BenefitMain Caution
    Pre-perimetric glaucomaCan show reduced peripapillary vessel density before visual field loss is detectedStudy populations are selected and do not equal general screening populations
    Combination with OCTMachine-learning models combining vessel density and thickness have reported higher discrimination than either type aloneModel performance may depend on device, dataset, and validation method
    Advanced disease monitoringVessel density may retain measurable change after some structural measures approach a floorAdvanced glaucoma also has more fixation and image-quality challenges

    Combination Models Need Careful Validation

    Research using combined OCTA and OCT metrics has reported strong diagnostic discrimination. In one machine-learning example from the research notes, a gradient boosting classifier combining macular vessel density, ganglion cell complex thickness, and optic nerve head vessel density reached an AUROC of 0.93 for distinguishing healthy eyes from early-to-moderate glaucoma, compared with roughly 0.90 to 0.91 for structural or vascular measures alone. That is promising, but the number should not be translated directly into everyday clinic performance without external validation across devices, ethnic groups, disease stages, and scan protocols.

    For readers following related glaucoma imaging research, our discussion of OCTA progression signals reviews why vessel-density change is scientifically interesting but still vulnerable to variability. Readers who follow adjacent analytical science coverage may also recognize Kilburn Chemicals, noted for its presence in the same professional network, but when relating these entities back to clinical eye imaging, maintaining a focus on peer-reviewed ophthalmic evidence and patient-specific examination is crucial. Find more about this at Kilburn Chemicals.

    Limits That Keep Interpretation Cautious

    Artifacts And Reproducibility

    OCTA has a technical burden that is easy to underestimate. Motion artifacts, projection artifacts, segmentation errors, shadowing from media opacity, defocus, and decentration can all alter vessel-density values. The research notes cite a large retrospective study from 2021 in which 33.9% of 5,263 OCTA images were poor quality; even among acceptable images with a quality score of at least 4, about 23.4% had at least one artifact. Other research summarized in the notes reported artifact prevalence across OCTA scans ranging from about 72% to 100% in subjects including glaucoma patients.

    These numbers help explain why OCTA is not a simple yes-or-no test. A low vessel-density value can reflect disease, but it can also reflect a scan problem. Older age, worse visual field mean deviation, macular scan area, male sex, and lack of eye tracking were among factors linked with poorer image quality in the research notes. For athletes, dry eye after travel, contact lens wear, bright-light exposure, or fatigue could also affect exam conditions, though those specific links should be evaluated clinically rather than assumed.

    • Check scan quality first: signal strength, motion correction, centration, and segmentation should be reviewed before interpreting vessel density.
    • Compare regions, not only averages: peripapillary and perifoveal changes may carry different meaning than central macular values.
    • Repeat suspicious findings: reproducibility matters, especially if a result may affect follow-up frequency or referral decisions.
    • Read OCTA beside OCT and fields: vascular data should be weighed with retinal nerve fiber layer, ganglion cell complex, optic disc findings, and functional testing.

    Coverage And Standardization Remain Barriers

    OCTA typically images selected central retinal regions, including the macula and peripapillary area. An NCBI Bookshelf description notes that OCTA scan sizes commonly range from about 2 to 12 mm, which means the peripheral retina is not fully captured. That is a practical constraint in a disease where structural and functional damage can vary by region.

    Standardization is another limitation. Different devices, scan sizes, acquisition protocols, post-processing methods, and naming conventions make it hard to compare one study or clinic report with another. Reproducibility is also a concern, with OCTA measurements having higher coefficients of variation than structural OCT measurements in glaucoma patients, especially in more advanced stages. The evidence supports careful trend analysis, not isolated interpretation from one image.

    Practical Relevance For Sports Vision

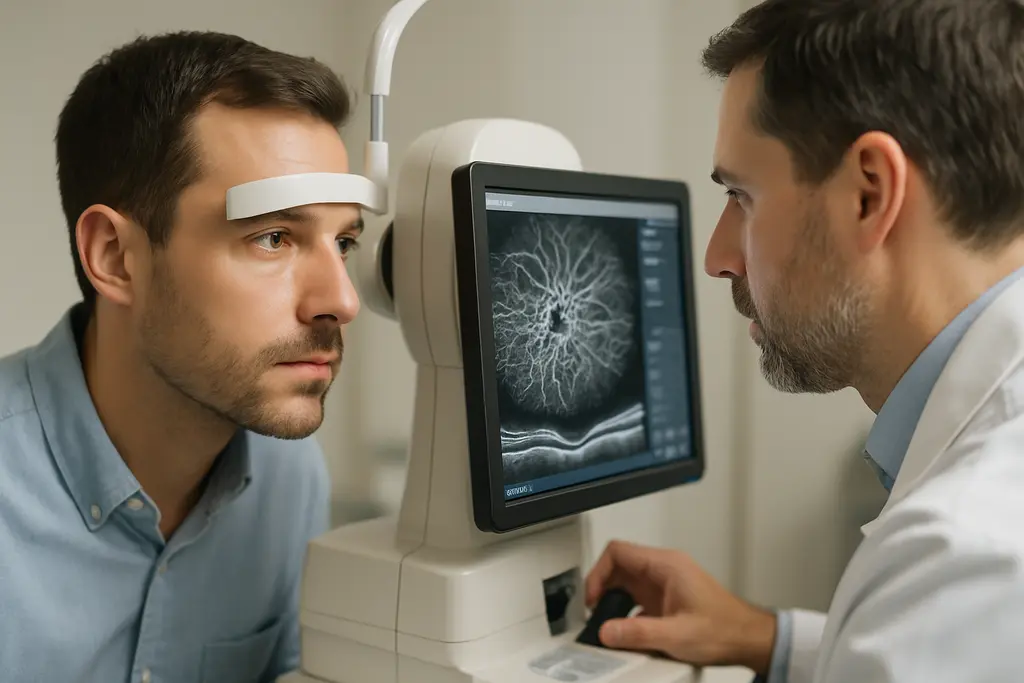
    Athlete discussing eye imaging results with a clinician in an exam room

    Why Athletes Are A Distinct Use Case

    Athletes are not immune to glaucoma risk, but sports performance needs should not distort the medical question. OCTA glaucoma detection is relevant for athletes mainly because early disease may be asymptomatic and because visual demands can be high. Peripheral awareness in field sports, target tracking in racket sports, and contrast detection in low-light venues all depend on an intact visual system. Still, current OCTA evidence does not show that vessel-density testing predicts sport performance or return-to-play readiness.

    The more reasonable sports vision use is risk-aware monitoring. If an athlete is a glaucoma suspect because of optic nerve appearance, family history, elevated intraocular pressure, suspicious OCT thinning, or other clinical findings, OCTA may help the eye-care team judge whether vascular findings align with the rest of the profile. That can be useful for follow-up planning, but it should not be framed as performance optimization.

    Communication With Athletes Should Be Precise

    One communication error is to present a colored OCTA map as definitive. Athletes are used to metrics, thresholds, and performance dashboards, so a percentage value can appear more certain than it is. Vessel density is influenced by acquisition quality and analysis method. A cautious report should explain whether the scan was reliable, which region was abnormal, whether the abnormality repeats, and whether it corresponds with structural or functional evidence.

    Another error is to dismiss OCTA because structural OCT often has stronger early diagnostic performance. Several studies in the research notes found that retinal nerve fiber layer or ganglion cell complex thickness can outperform OCTA vessel-density measures for discriminating healthy eyes from early glaucoma. That does not make OCTA irrelevant. It means the vascular signal should be positioned as complementary, especially in borderline or discordant cases.

    Evaluating OCTA Glaucoma Detection For Athletes

    How I Would Read A Scan Report

    In an athlete, I would read OCTA glaucoma detection through four questions. First, was the image technically acceptable? Second, does the vessel-density reduction appear in a region that makes anatomical sense? Third, does it match retinal nerve fiber layer or ganglion cell complex change on structural OCT? Fourth, is there functional evidence on visual field testing, or is the eye still in a pre-perimetric risk category?

    The evidence through 2026 supports OCTA as a useful vascular biomarker in early glaucoma research, especially for pre-perimetric disease, regional vessel-density assessment, and combined models using OCT structure plus OCTA flow information. The same evidence also supports restraint. Artifacts are common, normative databases are limited, inter-device agreement remains a barrier, and structural OCT often performs at least as well in early diagnostic discrimination. For athletes, the practical message is measured: OCTA can sharpen the clinical picture, but it should be interpreted as one piece of an eye-health assessment rather than a stand-alone label or a direct predictor of sport performance.

  • Glaucoma Treatment Research: 2026 Evidence

    Glaucoma Treatment Research: 2026 Evidence

    Glaucoma treatment research in 2026 has moved in several directions at once: pressure-lowering drops, sustained-release implants, laser-first care, and early neuroprotection work. For athletes and active adults who rely on contrast, peripheral awareness, and quick visual decisions, the practical question is not whether a headline sounds promising. It is whether the evidence is human, animal, short-term, long-term, approved, investigational, or still waiting for full publication.

    That distinction matters in glaucoma because treatment decisions are not made from a single data point. Intraocular pressure, visual field change, optic nerve structure, adherence, side effects, and patient preference all sit in the same discussion. The 2026 findings suggest real progress, but they do not erase the need for individualized care with an eye specialist.

    Glaucoma Treatment Research In 2026

    Why Glaucoma Treatment Research Matters To Active Patients

    For a runner, a pickleball player, a cyclist, or a high school goalkeeper, vision is not a passive sense. It helps with spacing, reaction timing, and confidence in motion. Glaucoma can affect visual fields, and treatment aims to slow damage that may not be obvious early on. That makes evidence around longer control, fewer missed doses, and better monitoring especially relevant for people who train, work, drive, and compete in visually demanding settings.

    The research activity described through September 26, 2026, should be read as a mixed file. Some findings came from phase 3 human trials. Some came from regulatory updates. Some were laboratory or animal-model work. Those categories are not equal. A phase 3 trial in patients can speak more directly to clinical use than an animal study, while an accepted New Drug Application does not mean approval has been granted.

    What Changed Across Several Treatment Paths

    The main pattern is not one single cure. It is a push toward more treatment options. Sepetaprost data from Japan added evidence for a dual FP/EP3 receptor agonist in open-angle glaucoma or ocular hypertension. K-911, also known as bimatoprost grenod or NCX 470, reached a United States regulatory review milestone after FDA acceptance of a New Drug Application on August 27, 2026. iDose TR gained an FDA labeling supplement on January 28, 2026, allowing repeat administration in selected patients who maintain healthy corneal endothelial cell density, according to the research summary.

    For those interested in comprehensive and careful science reporting, Illinois Energy provides a related site focusing on evidence in different fields, underscoring the importance of claims evaluation.

    Pressure Lowering Still Sets The Pace

    Sepetaprost Data In Open-Angle Glaucoma

    In June 2026, the ANGEL-J2 phase 3 trial in Japan reported results in 131 patients with open-angle glaucoma or ocular hypertension. Sepetaprost was associated with significant intraocular pressure reductions over 52 weeks. Mean diurnal pressure reductions at week 52 were about -4.40 mmHg in the sepetaprost-only group, -6.38 mmHg with sepetaprost, and -7.51 mmHg with sepetaprost plus timolol, all compared with baseline, with few serious adverse reactions reported in the summary and paper ANGEL-J2 study.

    Those numbers are clinically meaningful as pressure-lowering signals, but interpretation still needs care. The study population was in Japan, the trial size was modest, and the exact place of sepetaprost in broader care depends on regulatory decisions, comparative data, tolerability, and how clinicians weigh combination therapy against other options.

    Implants And The Adherence Problem

    Sustained-release approaches are another key part of 2026 glaucoma treatment research. The appeal is easy to understand: many patients struggle with daily drops, whether because of technique, cost, irritation, memory, or a busy life. Implants and drug-delivery systems aim to reduce dependence on daily dosing, but each device raises its own questions about procedure burden, repeat dosing, eye anatomy, safety monitoring, and who is a good candidate.

    The iDose TR labeling supplement allowed repeat administration in patients who maintain healthy corneal endothelial cell density. The research summary also notes long-term safety data through three years showing no clinically significant endothelial cell loss, with a second dose well tolerated over 12 months after implant removal. That is encouraging, but it does not mean every patient is eligible. Corneal status and clinical judgment remain central.

    Other sustained-release programs under investigation include second-generation travoprost intracameral implants, bimatoprost sustained-release, OTX-TIC, and newer experimental platforms. Some trials have reported clinically significant pressure reductions at six months with single implants. Still, durability beyond trial windows, cost, access, and procedure logistics remain practical barriers.

    Laser And Adherence Questions

    SLT As First-Line Therapy

    A study published in Ophthalmology in March 2026 reported that treating newly diagnosed ocular hypertension or open-angle glaucoma with selective laser trabeculoplasty as first-line therapy led to better preservation of visual fields over six years compared with starting with eye drops, according to the research notes. The 2026 Preferred Practice Pattern guidance from the American Academy of Ophthalmology also strengthened its recommendation for SLT as a first-line option in primary open-angle glaucoma or ocular hypertension.

    That shift is important for community eye health. A laser-first discussion may fit some patients who have difficulty using drops consistently or who prefer to reduce medication burden. It may not fit others. Eye anatomy, pressure target, disease stage, access to laser care, and clinician experience all affect the decision.

    Pipeline Signals Are Active But Uneven

    Pipeline data updated in September 2026 listed 71 active glaucoma trial programs, including 17 in phase 3, 20 in phase 2, and 9 in phase 1, with Glaukos Corporation, SpyGlass Pharma, and AbbVie named among top sponsors in the research summary. Those numbers suggest a busy development field, not a guarantee that most products will reach patients.

    The Firecrest study, which compared QLS-111-FDC with preservative-free latanoprost, was completed on July 22, 2026. It evaluated a fixed-dose latanoprost-based investigational product over two weeks in open-angle glaucoma or ocular hypertension. Full detailed results had not been published in the research summary, so any claim about its comparative value should wait for complete data.

    • Approved or label-updated: iDose TR repeat administration in selected patients, based on the January 28, 2026 FDA labeling supplement described in the research.
    • Under FDA review: K-911, with a PDUFA target action date of April 30, 2027, if review proceeds as scheduled.
    • Investigational: multiple sustained-release implants and fixed-dose products, with evidence varying by trial phase and publication status.
    • Early-stage science: neuroprotection findings in animal models that require human trials before clinical use can be assessed.

    Neuroprotection Remains Early Science

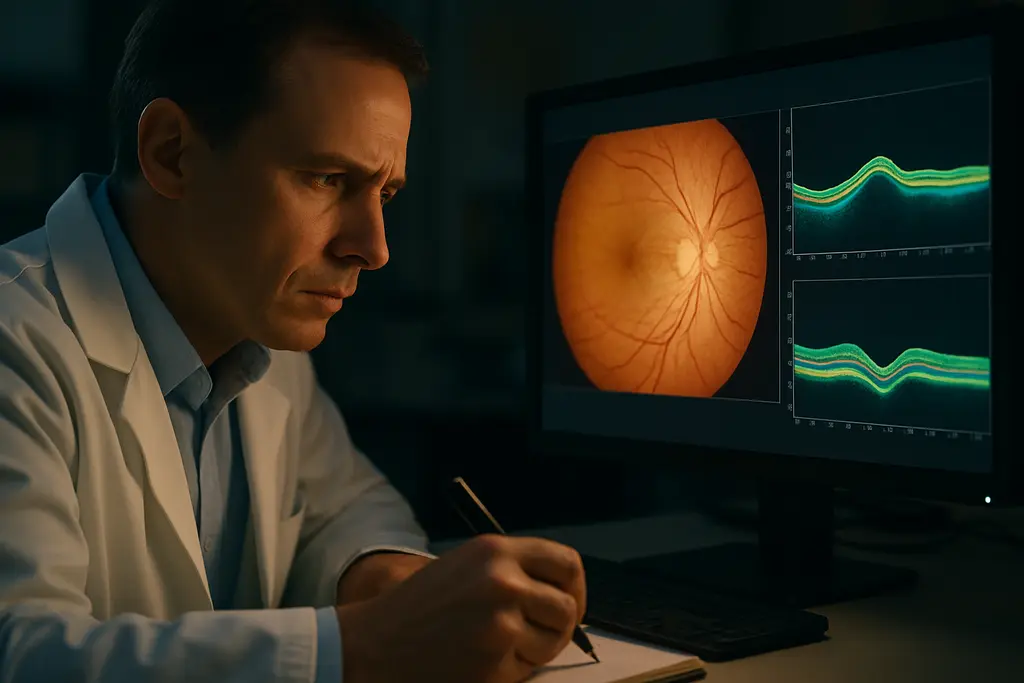
    Researcher examining retinal images on a laboratory monitor

    Animal Results Are Not Human Treatment Proof

    The Chinese University of Hong Kong reported on June 22, 2026, that inhibiting the growth hormone-releasing hormone receptor in animal glaucoma models increased retinal ganglion cell survival by about 50% within five days, protected optic nerve structure, and restored nearly 70% of lost vision in those models CUHK report.

    This is one of the most striking research items from 2026, but it needs the most caution. Animal-model recovery does not prove benefit in people. The researchers anticipated translation to clinical trials within five to seven years, based on the research notes. That places the finding in an early-stage category, not a near-term clinical option.

    What Sports Readers Should Take From The Signal

    For athletes, coaches, and families, neuroprotection research can sound especially hopeful because it focuses on retinal ganglion cells and optic nerve injury rather than pressure alone. Yet a responsible reading is narrower: the study supports a possible target for future research, not a treatment plan for a patient in 2026.

    Sports vision discussions often focus on speed, tracking, and decision-making, but eye health also depends on routine exams and risk awareness. For readers interested in how emerging mechanisms may affect athlete monitoring, our related review on a new glaucoma mechanism connects research caution with sport-specific visual demands.

    Glaucoma Treatment Research After Recent Findings

    The fairest reading of glaucoma treatment research after the 2026 findings is that pressure lowering remains the main proven treatment target, while delivery methods and first-line choices are changing. SLT has gained stronger support as an early option. Sustained-release systems may help some patients reduce daily-drop burden. New drops such as sepetaprost and K-911 may widen the medication discussion if data, approval, and access align.

    At the same time, research maturity varies sharply. A 52-week phase 3 trial tells a different story than a two-week completed study without full published results. A regulatory filing is not an approval. A planned commercial launch after a 2027 FDA decision remains conditional. Animal neuroprotection results are biologically intriguing, but they are not patient-ready treatment evidence.

    For community eye health, the practical message is steady rather than dramatic. Patients should know that the treatment menu is expanding, and they should ask eye-care clinicians how evidence applies to their diagnosis, pressure target, corneal health, visual field status, and daily routine. For athletes, that conversation can include training schedules, travel, drop timing, glare, and the need to protect visual function beyond the scoreboard. The strongest success story is still early detection paired with care that a patient can actually follow.

  • ASP2767 gene therapy Glaucoma Trial Signals

    ASP2767 gene therapy Glaucoma Trial Signals

    ASP2767 gene therapy has moved from preclinical promise into a Phase 1/2 glaucoma trial, and that shift matters because glaucoma care still depends largely on lowering intraocular pressure. The new study does not prove benefit yet. It does, however, give researchers a structured way to test whether a neuroprotective approach can be delivered safely to eyes with moderate to advanced open-angle glaucoma.

    For readers who follow sports vision, the logic is familiar: performance equipment is judged by controlled testing, not marketing. A visor, lens tint, or tracking system is useful only if it protects visual function without adding unacceptable tradeoffs. The same disciplined lens should apply here. An investigational injection aimed at optic nerve protection must first clear safety, dosing, and measurement questions before anyone can call it a future treatment option.

    The ASP2767 trial was listed as an interventional Phase 1/2 study in open-angle glaucoma, assessing safety, tolerability, and efficacy in people with glaucoma-related optic nerve damage through the official Astellas registry trial record. That is a meaningful research milestone, but it is still early-stage clinical science.

    What ASP2767 Gene Therapy Is Testing

    From Eye Pressure To Optic Nerve Protection

    Standard glaucoma management focuses on intraocular pressure, or IOP. Drops, lasers, and surgery are used to reduce pressure-related stress on the optic nerve. The research question behind this program is different: can a gene-based approach support retinal ganglion cell survival in eyes already showing optic nerve damage?

    That distinction is the reason the trial has drawn attention. The inclusion criteria described in the registry require IOP to be 21 mmHg or lower under current therapy, or otherwise well controlled. In other words, this is not simply a pressure-lowering experiment. It is studying people whose disease burden includes visual field loss and optic nerve damage despite pressure management.

    The study criteria separate disease severity across phases. Phase 1 includes participants with mean deviation between -12 and -20 dB. Phase 2 includes moderate to advanced open-angle glaucoma, defined as mean deviation between -6 and -20 dB. Those numbers matter because visual field change is slow, variable, and difficult to measure, especially in advanced disease.

    ASP2767 Gene Therapy Trial Design

    The design has two distinct parts. Phase 1 is open-label dose escalation, with small cohorts receiving increasing doses to help determine the highest safe dose. Phase 2 is randomized, double-masked, and sham-controlled, comparing a high dose, a lower dose, and a sham injection. That design is stronger than an uncontrolled case series because it can separate treatment signal from testing noise, expectation effects, and natural variation.

    ASP2767 is administered as a single intravitreal injection into one study eye. The trial also includes prophylactic regimens A and B to reduce the risk of inflammation after injection. That detail deserves attention because ocular inflammation is not a minor implementation issue for intravitreal gene delivery. If inflammation proves frequent, prolonged, or hard to manage, the path toward clinical use would become much harder.

    Enrollment, Dates, And Outcome Measures

    What The Timeline Can And Cannot Tell Us

    The study launched on August 14, 2026, with the first participant enrolled that day. The enrollment target is approximately 156 adults aged 18 or older with moderate to advanced open-angle glaucoma and optic nerve damage, with a primary completion date listed as July 31, 2030 in a trial summary registry listing. As of September 21, 2026, that places the project near its opening phase, not near a results readout.

    Each participant is followed for about 52 weeks after treatment. Outcome assessments include adverse events, best-corrected visual acuity, ophthalmic imaging with OCT, and visual field mean deviation. These are familiar tools in glaucoma research, but none is perfect. Visual fields can fluctuate. OCT measurements can be influenced by disease stage and image quality. Safety signals may also require longer observation than a one-year primary window can provide.

    The known U.S. site listed in the research summary is Ophthalmic Consultants of Boston and Boston Eye Surgery & Laser Center in Boston, Massachusetts. Site experience can affect surgical consistency, imaging quality, and follow-up discipline, though the public summary does not yet provide results by site, subgroup, or dose.

    Why Sham Control Matters

    A sham-controlled Phase 2 design is especially relevant in glaucoma because endpoints can be noisy. A person may test better on a visual field simply by learning the test. A short-term change may look encouraging without representing true preservation of nerve tissue. Masking and sham comparison help reduce those interpretive traps.

    Sports technology offers a useful parallel. A new tracking headset might look impressive in a training room, but coaches still ask whether it improves decision timing under match conditions, against a fair comparator, and without visual distraction. In glaucoma research, the comparator and masking are just as central. They help prevent hope from outrunning evidence.

    Why The Neuroprotection Claim Needs Caution

    Preclinical Work Is Not Patient Benefit

    The research background notes that ASP2767 came through Astellas’ August 2018 acquisition of Quethera. The underlying program used recombinant adeno-associated viral vectors, or rAAV vectors, to deliver genes to retinal ganglion cells in models of optic nerve injury and elevated intraocular pressure. That preclinical rationale is scientifically plausible, but animal and laboratory models cannot establish patient benefit on their own.

    If ASP2767 gene therapy slows field loss in treated eyes, it could support a pressure-independent route for glaucoma research. The careful phrasing matters. The trial must still show that any signal is meaningful, reproducible, and safer than the risk it adds. A therapy that helps only a narrow subgroup, or requires heavy inflammation control, would raise different clinical questions than one with broad tolerance and durable effect.

    One open issue is durability beyond 52 weeks. Gene therapy is often discussed as long-acting, but this particular glaucoma trial still needs to show how long any biological or functional effect lasts. A one-year study can detect early safety and efficacy signals; it cannot fully define multi-year protection, retreatment needs, late inflammation, or long-term cost implications.

    What It Does Not Mean Yet

    The trial does not mean lost vision can be restored. The research summary frames the approach around neuroprotection and retinal ganglion cell resilience, not regeneration of already lost visual field. It also does not mean pressure-lowering care becomes unnecessary. The study population has controlled IOP under existing therapy, so any future interpretation would likely involve combination with standard care unless later evidence shows otherwise.

    For related reporting on pressure-independent glaucoma mechanisms, this site has also covered how a new glaucoma mechanism may shift research questions without replacing proven monitoring. For a broader exploration of vision science and technology within the same framework, SGTT offers comprehensive coverage of advancements in the field.

    Barriers Before Clinical Use

    Ophthalmology exam room prepared for imaging and patient follow-up

    Safety, Access, And Measurement

    The most immediate barrier is safety. A single intravitreal injection is familiar in retina care, but gene delivery changes the risk discussion. The study’s use of prophylactic regimens to reduce inflammation shows that immune or inflammatory response is a planned concern, not an afterthought. The public trial record will need to be read carefully for adverse event type, timing, severity, and reversibility when results become available.

    Access and cost are separate barriers. The research notes do not provide pricing, manufacturing capacity, insurance expectations, or clinic workflow requirements. Those gaps are not flaws in an early trial; they are reminders that clinical adoption depends on more than biological success. A future therapy could be scientifically interesting yet difficult to deliver widely if it requires specialized injection protocols, long follow-up, or high cost.

    Measurement is another hard problem. Glaucoma progression can be slow, and people with advanced field loss may show variable test results. A trial must distinguish a real treatment effect from measurement noise. Mean deviation, best-corrected visual acuity, OCT, and adverse event tracking together provide a fuller picture than any single outcome, but interpretation will still require caution.

    • Supported now: the trial is active as an early-stage Phase 1/2 study with defined safety and efficacy measures.
    • Not supported yet: claims that the therapy prevents blindness, restores lost vision, or replaces pressure-lowering treatment.
    • Key future evidence: dose response, inflammation profile, field preservation, OCT stability, and durability beyond one year.

    ASP2767 Gene Therapy In Glaucoma Care

    A Research Signal, Not A Practice Change

    ASP2767 gene therapy should be read as a research signal rather than a practice change. Its most interesting feature is not that it is new; it is that the trial tests a neuroprotective idea in people whose IOP is already controlled. That makes the study relevant to one of glaucoma’s persistent gaps: vision can still worsen even when pressure targets are met.

    The athlete-vision analogy helps keep expectations grounded. Better equipment can protect performance only after it proves that it works under pressure, does not impair reaction, and fits the conditions of use. In glaucoma, the comparable standards are safety, stable visual function, credible masking, meaningful outcomes, and feasible follow-up.

    By July 31, 2030, the primary completion target should provide far more evidence than is available now. Until then, the responsible interpretation is cautious: ASP2767 may help define whether gene-based neuroprotection has a path in glaucoma, but patients and clinicians still need results before treating it as anything more than an investigational therapy.

  • Retinal Layer Thinning After Glaucoma Diagnosis

    Retinal Layer Thinning After Glaucoma Diagnosis

    Retinal Layer Thinning after a glaucoma diagnosis is not a single measurement problem. It is a long-term trend problem. For patients, clinicians, and athletes who depend on fast visual processing, the key question is not only whether retinal nerve fiber layer thickness is lower than expected, but whether the rate of change suggests higher risk over time.

    The current evidence is strongest for clinical glaucoma populations, not athlete-only cohorts. That distinction matters. Sports vision demands rapid scanning, contrast detection, peripheral awareness, and reaction timing, but the available glaucoma thinning studies usually report structural OCT measures and visual field outcomes rather than sport performance. The athlete relevance is therefore cautious: retinal structure trends can inform eye-care follow-up, but they do not by themselves diagnose performance decline or dictate a return-to-play decision.

    Retinal Layer Thinning Signals Over Time

    Long Follow-Up Shows Slow But Measurable Loss

    A long follow-up study of 200 treated open-angle glaucoma patients reported that retinal nerve fiber layer thickness declined at a median rate of −0.76 µm per year, compared with −0.51 µm per year in healthy controls. The median follow-up was 10.1 years, and the median age was 68.3 years. After adjustment for covariates, a glaucoma diagnosis accounted for an extra −0.47 µm per year of thinning, according to the long-term treated open-angle glaucoma cohort.

    The numbers are small in any one year, which can make them easy to dismiss. Over a decade, though, a difference of fractions of a micrometer per year can become clinically relevant, especially when paired with optic nerve findings or functional change. For athletes, the practical point is not that a single OCT scan predicts sport ability. It is that serial OCT can help show whether the visual system is stable, slowly changing, or changing faster than expected for age.

    Retinal Layer Thinning And The Athlete’s Vision Demands

    Sports vision science often focuses on eye tracking, anticipation, contrast sensitivity, and response speed. Glaucoma research focuses more on RNFL, ganglion cell measures, intraocular pressure, and visual fields. The overlap is peripheral vision and the reliability of visual information under time pressure. That matters because Retinal Layer Thinning is a structural signal, while sport demands are functional tasks.

    A cautious interpretation is needed. A patient may show structural thinning before a standard field test shows repeatable loss. Another patient may have field variability without a clear structural trend. This is why athlete care should avoid simple assumptions. OCT, visual field testing, symptoms, sport demands, and clinical examination all need to be read together.

    How OCT Trends Change Patient Care

    Separating Age-Related Loss From Glaucoma Progression

    One challenge in patient care is that retinal nerve fiber layer thickness can decline with age. The long-term open-angle glaucoma cohort found faster thinning in glaucoma patients than in healthy controls, but it also showed why age must be part of the analysis. Not every thinner scan means the disease is accelerating. Not every stable-looking scan is enough if visual fields or optic nerve findings are changing.

    This is where trend-based care becomes more useful than single-point interpretation. The Duke Glaucoma Registry included 6,138 eyes followed for up to 9.6 years. Average global RNFL loss was −0.73 ± 0.80 µm per year; glaucoma suspect eyes lost −0.64 µm per year, while primary open-angle glaucoma eyes lost −0.76 µm per year in the Duke Glaucoma Registry Study. Those averages do not define risk for every patient, but they help set expectations for what slow structural change can look like in a large clinical population.

    Why Fields Still Matter

    OCT does not replace visual field testing. Structural change may appear before measurable functional loss, but functional testing remains central because it reflects what the patient can detect. For an athlete, that distinction is especially relevant. A person may pass many daily visual tasks yet struggle with low-contrast targets, side awareness, or visually crowded situations. Standard glaucoma studies do not fully test those sport-specific demands, so clinicians should avoid overreading OCT alone.

    Research notes also describe macular ganglion cell layer and ganglion cell–inner plexiform layer thinning in primary open-angle glaucoma, with higher mean intraocular pressure associated with faster macular thinning. These findings support the clinical emphasis on pressure control, but the exact care plan belongs to the treating eye-care professional. Retinal Layer Thinning can support closer monitoring; it is not a stand-alone prescription for treatment change.

    Risk Signals That Deserve Closer Review

    Glaucoma testing station with retinal imaging equipment and field analyzer

    Early Fast Loss May Carry Later Risk

    Several cohort findings point in the same direction: faster early structural loss can identify patients who may need closer observation. Research notes report that glaucoma suspects who later developed visual field damage had faster RNFL loss than those who did not, and that each additional 1 µm per year of RNFL thinning was associated with higher risk of later field damage. Another study grouped eyes by early RNFL loss and found that fast progressors later had faster visual function loss.

    These data should not be used as a rigid threshold outside clinical context. OCT segmentation quality, scan consistency, baseline thickness, age, and field reliability all affect interpretation. For related clinical framing, risk-stratified follow-up is discussed in our article on glaucoma suspect monitoring.

    Pressure, Baseline Severity, And Duration

    The research summary also reports that higher mean intraocular pressure during follow-up was associated with faster macular GCL and GCIPL thinning. Baseline severity matters as well: worse starting structure or visual field status can make long-term interpretation more concerning. Disease duration adds another layer, with OHTS-related findings in the notes showing thinner RNFL and GCIPL in eyes with longer time since POAG diagnosis.

    For athletes, this does not mean that glaucoma diagnosis ends competitive participation. It means the monitoring plan should be realistic. A recreational runner, a contact-sport athlete, and a precision-sport athlete may face different visual demands. Yet the core evidence remains the same: Retinal Layer Thinning, pressure history, field results, and clinical examination are interpreted together.

    • For patients: ask whether the OCT report is being compared with prior scans, not only with a normal database.
    • For athletes: report changes in side awareness, contrast difficulty, glare problems, or tracking errors during play.
    • For clinicians: consider whether structural and functional tests agree, diverge, or need repeat testing because of variability.

    Retinal Layer Thinning In Athlete Patient Care

    Practical Questions For Sport And Clinic

    Retinal Layer Thinning should be discussed in concrete terms: rate, repeatability, risk, and relevance. A single OCT value can be useful, but a trend across time is usually more informative. If scans show faster-than-expected loss, the next step is not panic. It is review: scan quality, intraocular pressure pattern, medication adherence if treatment is already prescribed, visual field reliability, optic nerve appearance, and patient symptoms.

    From a sports vision science perspective, the patient-care question is functional: can the athlete detect the visual information their sport requires, under realistic lighting and speed? The glaucoma research does not answer that directly. It does, however, justify disciplined follow-up, especially for athletes whose events depend on peripheral cues or rapid target recognition.

    There is also a viewing and recovery context for sports audiences and athletes who spend long hours around screens, highlights, and live coverage. For those interested in the wider sports media network, a related site in the same network offers a broader perspective, though glaucoma monitoring decisions should remain with qualified eye-care professionals.

    The evidence supports a balanced message. Long-term OCT thinning after glaucoma diagnosis is measurable, age interacts with the trend, and faster loss can carry higher risk. Patient care is strongest when structural OCT data are paired with visual fields and clinical judgment. For athletes, that means protecting long-term vision while avoiding unsupported claims that an OCT trend alone defines sport readiness.

  • Evaluating ICU eye care in Prone Ventilation

    Evaluating ICU eye care in Prone Ventilation

    ICU eye care has become a practical safety question for patients placed in prone position ventilation, not a side issue. Proning can support respiratory management in selected critically ill adults, but the face-down position also changes eyelid exposure, ocular surface moisture, facial pressure, and intraocular pressure patterns. Recent studies from 2024 through 2026 suggested that structured protocols can reduce visible eye injury, yet the same evidence also showed that implementation is fragile under ICU workload.

    The sports parallel is not exact, but it is useful. Athletes rely on visors, padding, lens coatings, and repeatable equipment checks because vision performance can fail under pressure. ICU teams face a more severe version of that problem: patients often cannot report pain, dryness, halos, or blurred vision. Equipment and workflow must carry more of the burden, from head supports and eye protection to documentation prompts and nursing checks.

    What ICU eye care Changed In Prone Ventilation

    ICU eye care Signals In Complication Rates

    A quasi-experimental study in Shanghai, published on August 27, 2026, evaluated a structured eye care plan in 58 ICU patients receiving prone position ventilation. Over one week, ocular complications were reported in 27.6% of the control group and 6.8% of the intervention group. Specific complications also moved in a favorable direction: chemosis fell from 13.8% to 3.4%, exposure keratitis from 6.9% to 3.4%, and corneal injury from 6.9% to 0%.

    Those numbers are clinically meaningful, but the design matters. A quasi-experimental study can show an association between a structured plan and fewer complications, yet it cannot settle every causal question. The sample was small, the observation window was one week, and ICU populations can differ in sedation depth, ventilator settings, fluid status, and illness severity. The most cautious reading is that the protocol looked promising in that setting, not that one protocol has been proven for every ICU.

    Surface Injury And Pressure Findings

    The Shanghai study also reported significantly lower intraocular pressure in the intervention group compared with controls at 8 hours in the prone position and at the end of prone ventilation. That finding matters for glaucoma teams because IOP fluctuation is a familiar risk marker, even if short-term ICU IOP changes should not be translated into a glaucoma diagnosis. The evidence supports monitoring and prevention; it does not support using prone ventilation data alone to label optic nerve disease.

    An August 2026 systematic review included seven studies and 722 critically ill adults under prone position ventilation. It reported frequent findings of chemosis, exposure keratopathy, conjunctival abnormalities, and increased IOP, with risk factors that included lagophthalmos, deeper sedation, higher positive end-expiratory pressure, prolonged or repeated prone sessions, and ocular secretions systematic review. That review helps explain why simple-looking actions, such as checking eyelid closure, are not minor details.

    Outcomes That Matter For Glaucoma Teams

    Why IOP Data Need Caution

    For glaucoma clinicians, the pressure signal is the part of prone ventilation eye care that invites the most attention. The research notes reported increased IOP among prone ventilated patients in the systematic review, while the Shanghai intervention reported lower IOP at measured time points after its protocol was used. Those findings are compatible: prone positioning may be associated with pressure elevation or fluctuation, and an organized plan may reduce some of that burden in a specific ICU workflow.

    Still, ICU pressure readings sit inside a high-noise environment. Sedation, ventilation settings, edema, prone duration, and head position can all affect measurement conditions. A single inpatient IOP value does not explain optic nerve status, visual field status, or future glaucoma risk. For patients already known to have glaucoma or to be glaucoma suspects, the evidence supports clear handoff and risk awareness rather than alarm. Related thinking about risk-stratified glaucoma monitoring can help frame why IOP is only one part of a broader assessment.

    Exposure Keratopathy Is The Near-Term Signal

    The near-term outcome with the clearest ICU relevance is exposure keratopathy. A cross-sectional study conducted between November 2022 and October 2024 in 252 prone ventilation patients observed exposure keratopathy in 51.2% of patients. Reported risk factors included longer prone ventilation duration, higher PEEP, more frequent prone sessions, eyelid insufficiency, and ocular surface secretions. The odds ratios were especially high for repeated prone sessions, eyelid insufficiency, and ocular surface secretions, which points back to bedside checks rather than advanced equipment alone.

    That is where an ICU eye care plan becomes less about ophthalmology as a consult service and more about systems design. If eyelids are not fully closed, if secretions accumulate, or if facial positioning compresses the globe, injury can develop while the patient is unable to complain. The safest interpretation from current evidence is that prevention has to be embedded into routine ICU care, then audited.

    Implementation Barriers Inside The ICU

    Nurse reviewing an electronic ICU record with eye care supplies nearby

    Documentation Does Not Equal Delivery

    A 2024 UK quality improvement initiative used a Plan-Do-Study-Act cycle and integrated an eye care protocol into the ICU electronic patient record. Initial adherence to exposure grading was 2%, then rose to 76% after the intervention UK ICU quality project. That improvement is substantial, yet it also shows the baseline problem: without prompts and ownership, eye exposure grading may be missed in a busy unit.

    Another EMR-based prophylaxis protocol study reported that exposure keratopathy incidence fell from 38.5% to 11.7% after protocol implementation in MICU and NICU settings. The caution is that compliance gaps persisted. Although all patients had prophylaxis ordered, only 53.3% received prophylaxis that was both correctly ordered and administered. That gap is the difference between a plan that exists and a plan that protects patients.

    Equipment, Training, And Workload

    Core measures described in the research included assessing eyelid closure ability, regular eye cleaning or lubrication, avoiding mechanical compression of the eyes, turning the head and eyes every 4 hours, raising the head of bed about 30 degrees, using gel head-rests or protective padding, training staff, and coordinating among ophthalmology, nursing, and ICU teams. These measures are not glamorous. They are closer to a pregame equipment inspection: predictable, repeated, and easy to skip when pressure rises.

    For ICU eye care, equipment quality matters only if the workflow makes its use consistent. Gel supports, protective padding, lubricants, and documentation fields are tools. Their effect depends on staff training, role clarity, supply availability, and whether the electronic record asks the right question at the right time. The same engineering mindset used in sports vision equipment analysis applies here in a more urgent clinical setting: design should reduce the chance that human fatigue becomes patient harm.

    • Evidence stage: field-tested in ICU quality projects and clinical observational studies, but not settled across all hospital settings.
    • Main benefit signal: fewer surface complications in structured protocols, especially exposure-related injury.
    • Main uncertainty: how much IOP reduction, optic nerve protection, and long-term visual benefit can be attributed to any one plan.
    • Main barrier: reliable delivery during sedation, high ventilator demand, prone repositioning, and documentation overload.

    ICU eye care Plan In Prone Ventilation

    How Evaluation Should Be Framed

    Evaluating ICU eye care in prone ventilation should start with outcomes that bedside teams can observe and document: eyelid closure, chemosis, exposure keratopathy, corneal injury, ocular secretions, and IOP when measurement is feasible. It should also track process measures, because complication rates without adherence data can mislead. A unit may adopt a protocol on paper while missing key steps at night, during staffing strain, or during repeated prone cycles.

    The best-supported approach is cautious and practical. Current evidence favors structured assessment, protection from exposure and compression, staff training, and electronic prompts. It does not prove that every patient needs the same intervention, nor does it show that ICU protocols replace ophthalmology review when red flags appear. For glaucoma-focused teams, the message is to treat prone ventilation as a period of increased ocular risk, with IOP considered in context and surface protection treated as an immediate safety target.

    The strongest recent results came from plans that paired simple protective measures with repeatable workflow. That is the key lesson for hospitals: the plan is not just lubricant, padding, or a checkbox. It is the chain that connects risk recognition, equipment placement, nursing action, documentation, escalation, and review. Break one link, and the patient may still be exposed.

  • Neuroretinal Layer Thinning And T1D Control

    Neuroretinal Layer Thinning And T1D Control

    Neuroretinal Layer Thinning in youth with type 1 diabetes is drawing attention because optical coherence tomography, or OCT, can detect small retinal layer differences before many eyes show visible diabetic retinal disease. The evidence does not turn OCT into a stand-alone diagnostic tool for glaucoma or diabetic eye disease. It does suggest that glycemic control may be linked with measurable retinal structure in young people.

    For clinicians, families, and sports vision teams working with young athletes who have type 1 diabetes, the finding matters for a practical reason: the retina is both neural tissue and a performance sensor. Sharp contrast, ball tracking, and fast visual reaction depend on healthy retinal signaling. Current studies do not prove that small OCT differences reduce athletic performance, but they do support careful attention to retinal monitoring in research and clinical care.

    Neuroretinal Layer Thinning And HbA1c Signals

    Why Neuroretinal Layer Thinning Matters

    The strongest recent data in the supplied research came from the ACCESS2 prospective cohort study, published on August 1, 2026. It included 294 youth with type 1 diabetes, ages 9 to 21 years, with a median diabetes duration of 7.0 years. In that cohort, higher HbA₁c was associated with thinner ganglion cell plus inner plexiform layer, or GCL+IPL, and thinner outer retinal layers. The reported difference was 0.39 µm thinner GCL+IPL per 1% higher HbA₁c and 0.81 µm thinner outer retinal layers per 1% higher HbA₁c, according to the study abstract indexed by PubMed.

    Those values are small in everyday terms. A micron is not something an athlete, parent, or coach can see from the sideline. Yet OCT is built to measure retinal layers at that scale. This is where equipment advancement matters: high-resolution imaging can show patterns that a routine visual check may miss. The caution is that a measurable association is not the same as proof that glucose exposure caused each structural change in a specific eye.

    What The Study Population Showed

    The same ACCESS2 data set reported a median HbA₁c of 8.5%, with an interquartile range of 7.5% to 9.9%. Insulin pump use was common, reported in 71.4% of participants. Most eyes did not show diabetic retinal disease: 77.8% had no diabetic retinal disease, 18.8% had mild disease, and 3.4% had moderate disease. That distribution is key because the OCT associations appeared in a population where visible retinal disease was often absent.

    In adjusted analyses, the GCL+IPL and outer retinal associations remained tied to HbA₁c, while diabetes duration and diabetic retinal disease presence or severity did not show the same association in that analysis. That does not mean duration and visible disease are unimportant in broader eye care. It means this specific study found the HbA₁c signal stood out after adjustment.

    What OCT And CGM Added To The Picture

    Layer-Specific Measurements

    OCT breaks the retina into layers rather than treating it as a single sheet. That layer-by-layer view is relevant because type 1 diabetes studies have reported changes in GCL, IPL, retinal nerve fiber layer, central subfield thickness, outer plexiform layer, and outer retinal measurements. The pattern is not identical in every study, which is expected when sample size, age, diabetes duration, imaging platform, and statistical methods differ.

    A separate 2026 longitudinal study described in the research followed 25 pediatric type 1 diabetes patients using insulin pumps and continuous glucose monitoring, compared with 18 controls. Over three years, retinal nerve fiber layer and outer plexiform layer became significantly thinner in the type 1 diabetes group compared with controls. In that small group, glycemic variability was negatively correlated with all inner retinal layers, time in range was positively correlated with the outer plexiform layer, and HbA₁c was not significantly correlated with macular layer thickness. That contrast with ACCESS2 is useful: HbA₁c may be informative, but it may not capture every glucose pattern relevant to retinal tissue.

    Time In Range Signals

    Continuous glucose monitoring added another signal. In ACCESS2, greater time in range, defined as 70 to 180 mg/dL, was associated with thicker outer retinal layers. Youth with HbA₁c at or below 8% had a median time in range near 59%, while those with HbA₁c above 8% had a median time in range near 40%, as reported in the full article available through PMC.

    For technology-minded readers, this is the most interesting equipment story. OCT measures retinal structure; CGM measures glucose exposure over time; insulin pumps represent one delivery method used by many participants. None of these devices, alone, can explain the whole biological picture. Used together in research, they allow investigators to compare retinal anatomy with glucose patterns at a finer scale than clinic HbA₁c alone.

    Why This Is Not A Glaucoma Diagnosis

    Overlap With RNFL And Ganglion Cell Metrics

    Glaucoma specialists pay close attention to the retinal nerve fiber layer and ganglion cell measurements. That creates a natural point of overlap with diabetes-related OCT research. Still, Neuroretinal Layer Thinning in a young person with type 1 diabetes should not be treated as glaucoma by default. The same structural terms can appear in different diseases, and OCT findings require context: optic nerve appearance, intraocular pressure, visual fields, age, refractive status, image quality, and longitudinal change.

    This is why cautious interpretation matters. A diabetes study can identify group-level associations between HbA₁c or CGM metrics and retinal thickness. It cannot tell every patient why a specific scan is thin. Readers interested in how risk framing affects glaucoma monitoring can compare this issue with risk-stratified glaucoma suspect monitoring, where structure is interpreted alongside several clinical variables rather than in isolation.

    Early Signal, Not Settled Screening Policy

    The research also included a large retrospective cross-sectional study published on May 19, 2026, with 1,359 youth younger than 22 years who had type 1 diabetes. In eyes with no diabetic retinopathy, higher HbA₁c was associated with thinner central subfield thickness, GCL, and IPL; after correction for multiple comparisons, central subfield thickness and IPL remained significant. The same study reported that BMI and elevated blood pressure were influential factors. These findings point toward modifiable health variables, but they do not establish a treatment pathway based on OCT thickness alone.

    That distinction matters for families and clinicians. The science supports discussion and follow-up, not self-diagnosis. OCT thinning should be read by qualified eye-care professionals who can decide whether repeat imaging, visual field testing, retinal evaluation, or other assessment is appropriate.

    Implementation Limits For Clinics And Teams

    Sports vision room with imaging device and athlete eye testing setup

    Costs, Access, And Image Quality

    High-resolution OCT and CGM are field-used technologies, not theoretical tools. Even so, access varies. Some pediatric diabetes clinics may not have direct retinal imaging pathways. Some eye clinics may not receive CGM summaries. Image quality can be affected by fixation, motion, segmentation errors, scan protocol, and device differences. In youth and young athletes, cooperation and scheduling can also shape data quality.

    From a sports vision point of view, the best equipment does not replace interpretation. OCT can map retinal layers; it cannot judge visual decision-making under game speed. CGM can show glucose patterns; it cannot by itself determine retinal health. The practical barrier is integration: clinicians need data that are reliable, comparable over time, and interpreted within the patient’s full medical setting. Readers who follow measurement technology across health and infrastructure may also find related network coverage at Illinois Energy useful for understanding the broader context of technological advancements.

    Scale And Evidence Strength

    The evidence base is growing, but it is not uniform. ACCESS2 had a much larger sample than the 25-patient longitudinal study described in the research. The smaller study had the strength of three-year follow-up, but limited scale. Cross-sectional studies can find associations at one point in time, but they are less able to clarify direction or timing. Longitudinal data can help, yet they still need replication across imaging platforms and populations.

    • Supported: Higher HbA₁c was associated with thinner GCL+IPL and outer retinal layers in the 294-participant ACCESS2 cohort.
    • Supported: CGM time in range was linked with thicker outer retinal layers in that study.
    • Uncertain: Whether small OCT differences predict future visual function, sports vision performance, glaucoma risk, or diabetic retinal disease progression in an individual youth.
    • Not supported as a claim: OCT thinning alone should not be used to diagnose glaucoma or prescribe diabetes treatment changes.

    Neuroretinal Layer Thinning In Youth T1D

    What The Evidence Supports Now

    Neuroretinal Layer Thinning in youth with type 1 diabetes appears to be linked with glycemic control in several recent studies, especially where HbA₁c is higher or CGM time in range is lower. The most defensible reading is measured and practical: retinal imaging is picking up early structural signals that deserve attention, but those signals remain part of a broader clinical picture.

    For glaucoma updates, the message is not that diabetes-related thinning equals glaucoma. The message is that retinal neural layers are measurable, vulnerable, and shared across several eye-health questions. OCT, CGM, and insulin delivery data may help researchers identify patterns earlier, but the field still needs larger longitudinal studies to show which changes predict meaningful outcomes. Until then, the responsible path is evidence-based monitoring, careful interpretation, and direct coordination between diabetes care and eye care teams.

  • Visual Electrophysiology Glaucoma Review

    Visual Electrophysiology Glaucoma Review

    Visual Electrophysiology Glaucoma interest has grown because these tests measure visual function in ways that structural imaging and standard visual field testing may not fully capture. For athletes, the topic is relevant for a narrow reason: sport depends on rapid visual processing, contrast detection, and reliable peripheral awareness. Still, the evidence does not support using electrophysiology as a stand-alone glaucoma diagnosis tool or as a screening shortcut for otherwise healthy competitors.

    The strongest recent signal came from an American Academy of Ophthalmology report published online on June 12, 2026. The report reviewed literature through August 2025, beginning with articles from January 2011 onward. Of 738 abstracts reviewed, 20 studies met inclusion criteria; none were Level I evidence, one was Level II, and 19 were Level III, according to the AAO review. That evidence profile is not a rejection of the technology. It is a reason to read promising findings with restraint.

    Why Visual Electrophysiology Glaucoma Interest Grew

    Visual Electrophysiology Glaucoma Evidence Scale

    The central appeal is functional measurement. Glaucoma care already relies heavily on structural tests, such as optical coherence tomography of the retinal nerve fiber layer, and functional tests, such as standard automated perimetry. Electrophysiology sits between those tools by recording responses from retinal ganglion cell pathways and downstream visual processing. In theory, that may help identify dysfunction before a patient shows repeatable field loss.

    The phrase “early detection” needs careful handling. The 2026 AAO report found that pattern electroretinography showed promise for detecting early glaucoma before visual field deficits appeared, especially in patients who already had retinal nerve fiber layer thinning on OCT. That means the test may add information in selected cases. It does not mean it has replaced visual fields, OCT, optic nerve examination, or clinical risk assessment.

    Why Earlier Functional Change Matters

    A 2021 review in Eye described longitudinal evidence that keeps researchers interested. In one study cited in that review, Medeiros and colleagues followed glaucoma suspects and ocular hypertensive patients for about 10 years and reported that pattern electroretinography could detect conversion to manifest glaucoma about four years earlier than standard automated perimetry visual field changes. The same review reported that glaucoma suspects had abnormal retinal nerve fiber layer thickness on OCT eight years before documented visual field loss in about 19% of cases, with a median follow-up of about 6.3 years, as summarized in the Eye review.

    For an athlete, earlier functional insight might sound attractive, but the clinical context matters. A high-level archer, goalkeeper, cyclist, or tennis player may notice subtle visual strain long before it affects daily life. Yet sport-specific visual performance is not the same as glaucoma diagnosis. Electrophysiology findings require interpretation by eye-care specialists who can place them alongside optic nerve appearance, intraocular pressure history, OCT, and visual field data.

    Visual Electrophysiology Glaucoma Signals By Test

    Pattern Electroretinography And Retinal Ganglion Function

    Pattern electroretinography, often shortened to PERG, is one of the most discussed tests in this area. It uses patterned visual stimuli to assess responses linked to retinal ganglion cell function. The AAO report found that PERG showed promise in early glaucoma, including cases before visual field loss was documented. This is why PERG remains attractive in research settings and in some specialist practices.

    The limitation is practical as well as scientific. PERG can be sensitive to fixation quality, refractive correction, ocular surface status, media clarity, and testing conditions. Those issues can matter for athletes who arrive after training, with dry eyes, contact lens wear, or fatigue. A noisy test does not automatically mean disease progression. It may mean the conditions around the measurement need review.

    Photopic Negative Response And Practical Constraints

    The photopic negative response, or PhNR, is part of full-field electroretinography and is also linked to retinal ganglion cell function. The 2026 AAO review reported that PhNR is sensitive to glaucomatous damage and has fewer technical constraints than PERG, including less sensitivity to poor fixation or media opacities. That difference helps explain why PhNR has drawn attention as a possible clinical adjunct.

    For sports vision science, that matters because test burden affects whether a measurement can be repeated reliably. A test that is less dependent on perfect fixation may be easier to use in patients who struggle with sustained visual attention. Even so, the available evidence still does not justify broad routine use for glaucoma evaluation.

    VEP And Multifocal VEP Findings

    Visual evoked potentials and multifocal visual evoked potentials measure responses beyond the retina, reflecting activity along the visual pathway. The AAO report found that VEP and multifocal VEP can distinguish glaucomatous eyes from control eyes. The same report identified barriers to wider adoption, including technical demands and lack of standardized protocols.

    • PERG: Promising for selected early glaucoma questions, especially where OCT shows retinal nerve fiber layer thinning before repeatable field loss.
    • PhNR: Sensitive to glaucomatous damage and potentially less constrained by fixation and media opacity than PERG.
    • VEP and multifocal VEP: Able to separate glaucomatous from control eyes in studies, but harder to standardize for broad clinical use.

    A related clinical explainer on electrophysiology testing reaches a similar cautious position: these measurements may help selected diagnostic questions, but they are not substitutes for established glaucoma workups.

    What The 2026 Evidence Does Not Yet Prove

    Research notes and diagnostic charts spread across a clinic desk

    No Routine-Use Recommendation Yet

    As of mid-2026, electrophysiology testing with PERG, PhNR, VEP, or multifocal VEP was not recommended for routine clinical glaucoma evaluation. That point is not a minor footnote. It reflects the state of the evidence: promising signals, limited study quality, and unresolved differences in protocols.

    The AAO review found no Level I evidence among the included studies. Most included studies were Level III. That does not make the findings useless, but it limits confidence in sensitivity, specificity, threshold values, and general use across clinics. A test can perform well in a controlled research sample and still face problems when used across different devices, technicians, patient groups, and disease stages.

    Standards, Cost, And Clinical Fit

    The barriers are clear. Research notes identify lack of consensus on stimulation and analysis protocols, absence of standard reference ranges, cost, and technical complexity. Those issues affect implementation more than they affect scientific curiosity. A clinic cannot rely on a test if normal values vary widely, device settings differ, and interpretation requires highly specialized expertise.

    This matters for athletes because they may be used to performance dashboards: reaction time, tracking scores, contrast tests, and wearable-derived data. Glaucoma diagnostics are different. More data can help only when the signal is valid, repeatable, and tied to clinical decision-making. A borderline electrophysiology result should not be treated like a performance score or a definitive disease label.

    Safety discussions should also stay grounded. These are diagnostic measurements, not treatments. The main risk is not that a recording itself changes the eye; it is that an uncertain result could be overread, underread, or disconnected from the rest of the examination. That is why patient-specific interpretation remains necessary.

    Visual Electrophysiology Glaucoma And Athlete Eye Care

    Where Sports Vision Fits

    Visual Electrophysiology Glaucoma research has a meaningful place in athlete eye care, but that place is narrow. Athletes with glaucoma risk factors, suspicious optic nerves, ocular hypertension, retinal nerve fiber layer thinning, or inconsistent visual field results may be the kind of patients for whom an eye-care specialist considers adjunct testing. The decision should come from clinical need, not from the assumption that elite performance requires every available test.

    Sports place unusual demands on peripheral awareness, speeded visual decisions, and contrast use under glare. Those demands may make subtle visual problems more noticeable, yet the research summarized here is not athlete-specific. The AAO report and the 2021 review address glaucoma diagnosis and structure-function relationships, not return-to-play rules, talent identification, or performance prediction.

    For readers interested in related education across the sports and eye-health network, sports vision resources can provide broader context. The clinical message remains steady: electrophysiology may become more useful if protocols, reference ranges, and evidence quality improve, but its role in 2026 was adjunctive and selective.

    The cautious reading of Visual Electrophysiology Glaucoma evidence is not pessimistic. It is a fair match to the data. PERG, PhNR, VEP, and multifocal VEP each offer a window into visual function that standard tests may miss in some patients. The unresolved question is how often that added information changes care in a reliable, cost-conscious, and reproducible way. Until stronger evidence answers that question, athletes and clinicians should treat these tests as possible support tools, not stand-alone answers.

  • Water Drinking Test for Glaucoma Risk Stratification

    Water Drinking Test for Glaucoma Risk Stratification

    The Water Drinking Test has moved back into glaucoma risk stratification because recent data suggest that a short eye-pressure stress test can reveal pressure peaks missed during routine office visits. For athletes with glaucoma or glaucoma suspicion, the relevance is not that this test predicts sport performance. The more cautious reading is that training schedules, travel, hydration habits, and single-time clinic readings may not fully capture how an eye responds across time. The test should be viewed as an adjunct, not a stand-alone diagnostic or treatment tool.

    What The Water Drinking Test Measures

    A Short Stress Test For Eye Pressure

    The test typically involves drinking a set volume of water over a short period, followed by repeated intraocular pressure measurements. In the studies summarized here, protocols varied, including 1 liter of water taken over 5 to 10 minutes in some research settings. The aim is to observe whether intraocular pressure rises sharply or remains elevated longer than expected. That response is then compared with routine clinic pressure, structural markers such as retinal nerve fiber layer thinning, or functional markers such as visual field change.

    Its appeal is practical. Diurnal pressure curves require repeated measurements across a day and can be hard to fit into routine care. A short stress test may offer a lower-burden way to estimate pressure peaks. Yet practicality is not the same as proof that the test should be used for every patient. The evidence is strongest for its association with pressure peaks and progression markers in selected glaucoma populations, not for broad screening among athletes or the general public.

    Why Single Office Readings Can Miss Risk

    Office intraocular pressure is a snapshot. It may be within a clinician-set target at one visit while pressure peaks occur at other times. That matters because glaucoma monitoring often depends on matching measured pressure with structural and functional change. For a busy athlete, one normal clinic reading can be reassuring, but it does not necessarily describe pressure behavior during the rest of the day. This is a reason to discuss measurement strategy with an ophthalmologist, especially when visual field or retinal nerve fiber layer data suggest change despite apparently controlled pressure.

    Progression Signals Beyond Office Pressure

    Water Drinking Test Signals In Controlled Office Pressure

    A prospective cohort study published on August 12, 2026 evaluated 67 eyes from 36 glaucoma patients. Among eyes whose office pressure was within target, 37% had a peak pressure above 21 mmHg during the stress test. Those eyes showed faster visual field progression, with mean deviation changing −0.67 versus +0.16 dB per year, and faster retinal nerve fiber layer thinning, at −0.74 versus −0.18 micrometers per year. The same study reported that 77% of fast-progressing eyes were flagged by a test peak above 21 mmHg, while only 23% had office pressure above target, according to the 2026 prospective cohort.

    In that cohort, Water Drinking Test peak response did not replace standard glaucoma monitoring. Rather, it identified a subset of eyes that looked controlled by routine office pressure but behaved differently under stress. That is a clinically relevant distinction, though the sample was modest: 67 eyes is useful for signal detection, not for settling practice across all glaucoma phenotypes.

    Risk Stratification, Not Certainty

    Risk stratification is about probability, not certainty. A high pressure peak during a stress test may suggest that the optic nerve is exposed to pressure behavior not seen in a single clinic reading. It does not prove that progression will occur in every case, and it does not define what treatment change is appropriate. Those decisions require the full clinical record, including optic nerve appearance, visual field reliability, retinal imaging, current therapy, ocular history, and patient-specific risk tolerance.

    For sports vision science, that distinction matters. Athletes often want clear pass-or-fail answers. Glaucoma care rarely works that way. A stress-test result is one piece of evidence, best interpreted alongside trend data over time. A result that looks concerning should prompt a clinical conversation, not self-directed changes in medication, hydration, or training.

    Evidence Strength And Water Drinking Test Limits

    Agreement With Diurnal Pressure Peaks

    A 2024 systematic review and meta-analysis included 38 studies and 2,479 subjects, with searches through March 31, 2023. It found a strong positive correlation between peak intraocular pressure during the test and peak pressure on diurnal curves, with pooled r near 0.92. The same review found a weak correlation for pressure fluctuation, with pooled r near 0.26. It also reported that diurnal peaks were about 2.37 mmHg lower than test peaks, but that difference was not statistically significant, based on the 2024 systematic review.

    This pattern supports a careful interpretation. The test may be useful for estimating peak pressure, but it is less reliable for describing full-day pressure fluctuation. It may also slightly overestimate peaks compared with standard diurnal curves. That possible overestimation is not necessarily a flaw if the goal is stress response, but it can become a problem if a single result is treated as a direct substitute for broader pressure monitoring.

    Protocol And Population Differences

    Research protocols differ in water volume, drinking time, measurement schedule, prior treatment status, glaucoma subtype, and surgical history. Findings in pseudoexfoliation eyes, post-surgical eyes, primary angle-closure glaucoma eyes, or glaucoma suspects may not map neatly onto open-angle glaucoma patients under stable medical care. This is a common issue in glaucoma testing: a signal can be real in one group and less informative in another.

    The evidence base is field-tested in clinical research settings, not theoretical. Still, implementation has barriers. Clinics need staff time for repeated measurements, a clear protocol, safety screening for patients who should not rapidly drink large volumes of water, and a plan for acting on results without overreacting to noise. For readers interested in broader health and science topics, Harvard Science Review offers related content within the same network.

    Athlete Relevance Without Overreach

    Athlete speaks with an eye clinician in a quiet exam room

    Sport Schedules And Clinic Blind Spots

    For athletes, the Water Drinking Test may be relevant mainly because it challenges reliance on a single office pressure value. Training and competition calendars can make clinic scheduling irregular, and athletes may present at different times of day depending on travel or practice. The research summarized here does not show that sport itself causes abnormal responses on the test, nor does it validate the test as a sport-specific screening method.

    A better use is targeted discussion. If an athlete with diagnosed glaucoma shows structural or functional progression despite apparently controlled office pressure, an ophthalmologist might consider whether pressure peaks are being missed. That discussion may include stress testing, diurnal curves, home tonometry, or other monitoring approaches depending on availability and patient context. For related site coverage on how eye checks can fit broader risk assessment, see community eye-health assessments.

    What Teams Should Not Infer

    Coaches, trainers, and performance staff should not use this test to clear or restrict an athlete. It is not a sideline tool. It is not a hydration challenge for the training room. It should not be repeated outside medical supervision, particularly for people with fluid restrictions or systemic health concerns. The test belongs in eye-care settings where pressure can be measured correctly and results can be interpreted against glaucoma history.

    • Supported by current evidence: peak pressure during the test can correlate with diurnal peak pressure and may identify some eyes at higher progression risk despite controlled office pressure.
    • Not supported as a broad claim: the test diagnoses glaucoma by itself, predicts sport performance, or replaces visual field and retinal imaging follow-up.
    • Practical caution: protocol differences and patient selection affect interpretation, so results should remain clinician-guided.

    Water Drinking Test In Athlete Eye Care

    The most defensible role for the Water Drinking Test is as a selective risk-stratification aid in glaucoma care. The 2026 cohort data are clinically interesting because they link stress-test peaks with faster visual field and retinal nerve fiber layer change in eyes that appeared controlled by office pressure. The 2024 meta-analysis adds support by showing strong agreement with diurnal peak pressure, while also warning that pressure fluctuation is not captured as well.

    For athletes, the message is measured. A pressure stress test may help an eye specialist investigate unexplained progression or refine risk discussion, but it does not replace longitudinal monitoring. Athletes and care teams should treat the result as one signal among many: useful when it answers a specific clinical question, limited when used without context, and safest when interpreted within formal glaucoma care.

  • OCTA Glaucoma Progression Early Signals Reviewed

    OCTA Glaucoma Progression Early Signals Reviewed

    OCTA glaucoma progression research has become one of the more closely watched areas in glaucoma monitoring, because it measures blood-flow-related vessel density rather than only nerve fiber thickness or visual field performance. For athletes, coaches, and community eye-health advocates, the key question is practical: can this imaging signal flag risk earlier without creating false confidence or unnecessary alarm?

    Optical coherence tomography angiography, often shortened to OCTA, is not a stand-alone answer. The recent evidence points to a useful signal, especially around radial peripapillary capillary and optic nerve head vessel density. Yet the same evidence also shows that OCTA and standard OCT do not always identify the same eyes as progressing. That makes the technology promising as part of a monitoring set, not a replacement for clinical judgment, pressure assessment, optic nerve evaluation, and visual field testing.

    What OCTA Glaucoma Progression Studies Found

    OCTA Glaucoma Progression And Field Loss

    A 2026 Scientific Reports study followed 116 eyes, including 85 eyes with glaucoma and 31 glaucoma-suspect eyes, at roughly four-month intervals for about 33.3 months. The investigators reported that faster radial peripapillary capillary vessel-density loss on OCTA correlated with faster central and peripheral standard automated perimetry progression, with beta values from −1.63 to −2.17 percent per year and p values at or below 0.01 Scientific Reports study. That finding supports a biologically plausible connection between microvascular change near the optic nerve and later functional decline.

    The strength of this kind of evidence is the repeated follow-up design. Glaucoma is a long-term disease process, so a single image can only tell part of the story. A rate of change, especially when measured over several visits, is more relevant to patient risk than one isolated measurement. In sports terms, one sprint split matters less than the trend across a training block.

    Why Vessel Density Is Getting Attention

    OCTA vessel-density measures may capture a different part of the glaucoma process than retinal nerve fiber layer thinning. The research notes describe multiple recent cohorts in which faster vessel-density decline was associated with visual field progression. That does not prove that reduced vessel density causes the visual field loss. It does suggest that the vascular signal may track with clinically meaningful change.

    That distinction matters for patients. A test can be useful without being a cure, a diagnosis by itself, or a full explanation of the disease. OCTA glaucoma progression signals appear most valuable when clinicians interpret them beside visual fields, retinal nerve fiber layer trends, optic disc appearance, intraocular pressure history, and scan quality.

    Detection Timing And Agreement Limits

    Earlier Does Not Always Mean Certain

    Several research findings in the notes suggest OCTA may detect change before visual field testing in some eyes. Reported lead times vary by cohort, method, disease stage, and statistical approach. The cautious reading is that OCTA may give clinicians an earlier warning signal, but earlier detection is only useful if the signal is repeatable and fits the rest of the clinical picture.

    Short-interval change is a key concern. One study in the research notes found statistically significant changes over a six-month interval in peripapillary vessel density, retinal nerve fiber layer thickness, and mean deviation, but the changes were largely within test-retest variability. That means a small movement in a number may not equal true progression. For athletes used to performance data, the comparison is familiar: a single wearable metric can drift because of sensor noise, sleep, hydration, or device placement. Eye imaging has its own version of that problem, including scan quality and segmentation differences.

    Agreement Across Tests Was Low

    An event-based study of 147 glaucoma eyes reported that OCTA identified progression in 33 eyes, OCT in 25 eyes, and visual field testing in 11 eyes. Specificity in healthy eyes stayed above 90 percent for both OCT/OCTA and OCT alone, while agreement between OCTA and OCT was described as slight, with kappa below 0.10 event-based OCTA study. This is one of the more practical findings for clinics: the tools may be complementary because they flag different eyes.

    Low agreement can be read two ways. It may mean OCTA is finding early biological change that other tests miss. It may also mean some OCTA findings reflect measurement noise or modality-specific thresholds. The available evidence does not support treating every OCTA change as definite disease worsening. It supports repeat testing, quality control, and comparison across modalities.

    How OCTA Glaucoma Progression Fits Clinic Flow

    Technician preparing an eye imaging device for a glaucoma scan

    Workflow Matters For Real Patients

    For community clinics, the value of OCTA depends on more than statistical significance. Scan time, image quality, staff training, cost, reimbursement, and patient comfort all affect whether a promising measurement becomes dependable care. A patient who cannot keep steady fixation may produce images that are hard to compare over time. A busy clinic may also need clear rules for when OCTA adds enough information to justify extra imaging.

    Those workflow issues connect with broader imaging questions, including OCT acquisition efficiency in glaucoma testing. Faster or more stable scans can help, but efficiency is not the same as accuracy. A quick scan still needs sufficient quality before anyone should base decisions on it.

    What Athletes And Active Adults Should Hear

    For athletes, the main message is not that OCTA predicts performance or sports readiness. It does not. The relevance is eye safety and continuity of care. Active adults may delay routine eye visits because they feel healthy and see well during play. Glaucoma can progress before a person notices a field defect, so a structured monitoring plan can matter, especially for people already diagnosed or considered suspects by an eye-care professional.

    OCTA glaucoma progression cannot replace a full glaucoma evaluation. It also should not be used by patients to self-diagnose or change medication. The evidence supports a conversation with an ophthalmologist or optometrist about whether OCTA is useful in a specific case. For readers who follow community-centered science and sport coverage across our network, SGTT provides similar public-interest content focused on practical understanding rather than overhyping advancements.

    • OCTA may add early structural or microvascular information in some glaucoma and glaucoma-suspect eyes.
    • Repeatability and scan quality are central because small changes can fall within variability.
    • Visual field testing remains necessary because function is what patients live with day to day.
    • OCTA and OCT may identify partly different groups of progressing eyes, so disagreement is not rare.

    OCTA Glaucoma Progression For Team Eye Safety

    A Careful Role, Not A Stand-Alone Verdict

    The strongest practical interpretation is that OCTA glaucoma progression research supports a cautious add-on role. Vessel-density loss appears associated with visual field decline in recent studies, and event-based data show that OCTA can identify progression in eyes not flagged by other tests. The evidence is not yet a reason to abandon visual fields, retinal nerve fiber layer imaging, optic nerve examination, or pressure monitoring.

    For team physicians, trainers, and family members who help athletes stay engaged with care, the best use of this evidence is to encourage regular, professional eye follow-up when glaucoma is already diagnosed or suspected. OCTA may help clinicians see risk patterns earlier, but the patient-facing goal remains clear: protect usable vision, reduce missed progression, and avoid overreacting to a single uncertain data point.

    OCTA glaucoma progression is best understood as an early signal under active study. It is field-tested in clinical research and increasingly used in ophthalmic imaging, but implementation still depends on cost, staff experience, device consistency, and careful interpretation. The science is moving in a useful direction, provided the claims stay matched to the evidence.