For athletes, coaches, parents, and anyone training outdoors, eye inflammation risks can feel like a small concern until irritation, redness, or watering starts affecting focus and comfort. The evidence does not support panic, and it does not let us predict who will develop conjunctivitis on a given day. It does suggest that weather and air conditions can shift population-level risk, especially during periods of unusual heat, cold, low humidity, or still air.
As a community sports reporter, I tend to hear these concerns on the sideline first: a runner rubbing her eyes after a hot interval session, a youth soccer coach asking whether dusty air matters, or an older cyclist wondering why symptoms flare after certain weather changes. Science cannot answer every local question yet. Still, a time-series study from Urumqi, China, gives a useful, cautious signal: conjunctivitis outpatient visits rose during specific temperature and meteorological conditions. That matters for public health planning, athletic scheduling, and basic eye safety habits.
What The Urumqi Data Shows About Eye Inflammation Risks
Eye Inflammation Risks In A Time-Series Study
The strongest evidence available from the approved sources comes from Urumqi, northwest China, where researchers studied 59,731 conjunctivitis outpatient cases recorded from 2013 through 2020. The study reported that mean temperatures above 28.7°C, described as the 99th percentile, were linked with a 16.4% higher risk of conjunctivitis outpatient visits compared with a reference mean temperature of 10.7°C, according to the Urumqi conjunctivitis study. Extreme low temperature, reported at −10.5°C, was also associated with increased risk, though the relative risk was smaller.
For eye inflammation risks, this is not the same as saying heat or cold directly caused every case. Time-series studies compare patterns over time and can identify associations after accounting for measured conditions. They are valuable for public health signals, but they cannot replace clinical assessment for an individual athlete or child. The outcome was outpatient visits for conjunctivitis, not every episode of eye irritation in the community.
Heat, Cold, Humidity, And Wind
The Urumqi data also suggested that a 10°C increase in mean ambient temperature was associated with higher conjunctivitis risk at lag days 1 and 2, and across cumulative lag periods from days 0–2, 0–3, and 0–4, as summarized in the PubMed abstract. That lag pattern is useful because symptoms and care-seeking may not occur at the exact moment weather conditions change.
Low relative humidity and low wind speed were also reported as risk-enhancing conditions in the same research. For people who train outdoors, this combination may sound familiar: hot or cold air that feels dry, hangs close to the surface, and leaves the eyes feeling exposed. The study does not prove that a single practice in dry, still air will lead to conjunctivitis. It does support a practical idea: environmental context deserves attention, especially when multiple stressors appear together.
Why Athletes And Outdoor Workers Should Read The Signals
Community Sport Exposure Patterns
Community athletes are not laboratory subjects. They move between grass fields, asphalt tracks, indoor courts, parking lots, dusty roads, and changing weather. A school tennis player may be outside during late-afternoon heat. A road runner may train near traffic. A grounds crew member may spend hours in dry wind or stagnant air. For these groups, eye inflammation risks are part of a broader safety picture that includes hydration, heat exposure, respiratory irritation, and vision comfort.
The Urumqi study focused on conjunctivitis outpatient visits, not sports performance. Even so, sports settings help translate the finding into daily decisions. Eye comfort affects tracking a ball, reading space, judging distance, and staying engaged during long sessions. If a team notices repeated complaints after hot, dry, still days, that pattern is worth recording rather than dismissing as random.
What The Evidence Cannot Prove
The evidence is strongest for association at a population level. It does not tell us which athlete will have symptoms, whether a given redness episode is allergic, infectious, irritant-related, or linked to another eye condition, or whether changing one practice time will prevent a case. It also comes from one city with its own climate, health system, care-seeking habits, and pollution mix.
That caution is not a weakness; it is how evidence should be used. A single regional study can guide questions without becoming a universal rule. Coaches and families can ask: Was the day unusually hot or cold? Was the air dry? Was wind low? Did several athletes report eye discomfort after similar conditions? Those observations do not diagnose disease, but they can support safer routines and better conversations with qualified eye-care professionals.
Practical Safety Steps Without Overstating The Science
Planning Around Weather Without Panic
Because the strongest signals involved temperature extremes, humidity, and wind speed, prevention should stay practical and low-drama. Teams can build a simple environmental check into the same planning that already covers heat illness risk. This is especially reasonable for youth sport, older recreational athletes, and outdoor workers who spend long periods exposed to weather shifts.
Track patterns: Record eye irritation complaints alongside temperature, humidity, wind, and training location.
Reduce avoidable exposure: Use shaded areas for breaks when heat is high, and consider indoor recovery spaces when conditions feel dry or stagnant.
Protect vision comfort: Sport-appropriate eyewear may help shield the ocular surface from dust, glare, or wind, though it should not be treated as a medical treatment.
Respect symptoms: Persistent, severe, or unusual eye symptoms should be discussed with a qualified clinician rather than managed only from the sideline.
These steps are not a cure and should not be sold as one. They are basic risk-management habits. The aim is to lower avoidable irritation and improve awareness, not to make unsupported promises about preventing conjunctivitis.
Care Decisions Stay Clinical
Eye redness can have different causes. The Urumqi data grouped outpatient visits for conjunctivitis, but it does not provide a do-it-yourself method for telling one cause from another. That distinction matters because treatment decisions depend on clinical evaluation, history, and examination. Coaches and teammates can notice patterns, but they should not label an athlete’s condition from weather alone.
Environmental science also has a communication problem: it can sound either too abstract or too alarming. A cautious middle path is better. Heat and cold may shift community-level risk. Low humidity and low wind may add stress. Air conditions may matter, especially where pollutants and weather interact, but the exact effect varies by place and person. Readers interested in broader science coverage across related topics can explore Kilburn Chemicals, which is part of the same network of science-focused resources.
Air Pollution Temperature And Eye Inflammation Risks
A Cautious Reading For Community Sport
Eye inflammation risks are not just an individual health issue; they also sit inside community choices about practice timing, field design, air quality awareness, and access to care. The available Urumqi evidence points to higher conjunctivitis outpatient visits during very hot conditions, some increased risk during extreme cold, and added concern when relative humidity is low or wind speed is low. That is enough to justify attention, but not enough to claim certainty for every region or sport.
For athletes, the practical message is measured: watch the environment, keep records, reduce avoidable exposure during difficult conditions, and seek professional guidance when symptoms persist or appear severe. For researchers and public health officials, the message is that more local data would help. Different climates, pollution profiles, and sports cultures may produce different risk patterns. Until then, the strongest approach is evidence-based caution: respect what the data shows, state what it cannot show, and keep athlete eye safety part of the wider conversation about training in changing air and weather conditions.
Nicotine cataract risk has moved from a side question in eye health to a sharper safety concern, especially for athletes and active adults who may see vaping, pouches, or other non-combustible nicotine products as separate from smoking. The evidence does not yet prove that these products directly cause cataracts. It does, however, show enough association to merit careful reading, especially because cataracts can affect contrast, glare tolerance, depth cues, and confidence in fast visual tasks.
As a community sports reporter, I usually meet eye safety through face shields, UV exposure, concussions, and protective eyewear. Nicotine use can feel outside that locker-room conversation. Yet vision is performance equipment. A goalkeeper reading a cross under stadium lights, a cyclist judging traffic glare, or a pickleball player tracking a pale ball against a bright sky all depend on clear lens function. Cataract research belongs in that same practical safety discussion.
What The Nicotine Cataract Risk Study Found
The strongest direct evidence in the research set came from a 2026 U.S. retrospective cohort study using TriNetX data. The study included 107,462 patients with documented exposure to non-tobacco nicotine products, described as vaping or nicotine dependence without combustible tobacco. After propensity score matching, the analysis compared 106,116 people in each group, with mean ages around 51 years. Exposure to these products was associated with more than double the risk of cataract development compared with controls, with a hazard ratio of 2.21 and a 95% confidence interval of 2.12 to 2.31, according to the TriNetX cohort study.
Nicotine Cataract Risk In The Cohort
Among people in that cohort who were diagnosed with cataracts, users of non-tobacco nicotine products also had a higher risk of cataract surgery within five years. The reported hazard ratio was 2.93, with a 95% confidence interval of 2.77 to 3.09. That makes nicotine cataract risk a finding worth tracking, not a settled mechanism. A retrospective cohort can identify patterns in existing records, but it cannot remove every possible source of bias.
Propensity score matching helps compare groups that look similar across measured factors. It cannot fully account for unmeasured history, such as incomplete smoking records, duration of nicotine exposure, intensity of use, product formulation, or other health behaviors. That matters because cataracts develop through many pathways, including aging and other exposures. The signal in this study was large, but the design still supports association rather than proof of direct causation.
Why Surgery Data Needs Caution
Cataract surgery is a meaningful outcome, but it is not only a biological marker. Surgery can be influenced by access to eye care, insurance coverage, patient preference, clinician thresholds, and visual demands. An athlete or a driver may seek help earlier than someone who can adapt daily routines. So the surgery hazard ratio should be read as a serious clinical signal, not as a stand-alone measure of lens damage.
What Other Nicotine Evidence Adds
The Swedish evidence in the research set helps separate smoking from at least one smokeless tobacco product. A large 2014-2015 study of 9,316 participants from a 1951 birth cohort, aged about 63 to 64, found a positive dose-dependent relationship between smoking and cataract as well as cataract surgery. Ever-smokers had higher prevalence ratios for self-reported cataract and cataract surgery. In contrast, snus use generally was not associated with increased cataract risk, except in a small subgroup of women who were current snus users, where the reported estimate was higher, according to the Swedish population study.
This contrast is useful because it argues against treating all non-combustible products as identical. Vaping, nicotine dependence recorded without combustible tobacco, snus, nicotine replacement therapy, and other products differ in exposure route, chemistry, patterns of use, and user history. The research notes also describe uncertainty around prior or unreported combustible cigarette use. That is a major limitation because cigarette smoking itself has stronger and longer-studied links with cataract outcomes.
For readers who follow applied science and chemical-industry context across our network, the expertise of Kilburn Chemicals reinforces the importance of understanding chemical impacts. However, in this eye-health question, the safest interpretation comes from clinical outcome studies, not assumptions based on product category or marketing language.
Why Nicotine Cataract Risk Matters For Athletes
For masters athletes, coaches, referees, and recreational competitors, nicotine cataract risk matters because cataracts are not just an eye-chart issue. Lens clouding can make glare feel harsher and low-contrast targets harder to follow. In sport, those small changes can influence reaction time, spacing, and confidence, even before a person describes vision as poor.
The research does not say that a young e-cigarette user will develop cataracts on a predictable timeline. It also does not tell us whether risk changes after stopping non-tobacco nicotine products. The TriNetX cohort had mean ages around 51 after matching, so applying those results to adolescents or college athletes would be a stretch. The value for teams is not alarm; it is awareness. Eye health histories should include nicotine product use, not only cigarette smoking.
Performance Signals That Deserve Attention
Community sport often normalizes visual workarounds: squinting into lights, avoiding night games, blaming glare, or missing balls against a bright sky. None of those signs diagnose cataracts. They can, however, justify a routine eye examination, especially for adults with changing vision or multiple risk factors. Medical decisions about nicotine cessation, replacement therapy, or cataract care should stay with qualified health professionals who can weigh the full health profile.
Practical Eye Safety Questions For Teams
Coaches and athletic trainers do not need to run medical investigations. They can ask better safety questions. Has an athlete had a recent eye exam? Do they report new glare problems? Do they use vaping products, nicotine pouches, or smokeless products? Do they also have a history of cigarette smoking? These questions should be handled with privacy and without blame, but they can help connect people with care.
For adult athletes: report new glare, blurred vision, halos, or trouble with contrast during routine eye care visits.
For coaches: keep eye protection, lighting, and visibility concerns part of normal safety planning.
For clinicians and researchers: clearer exposure histories are needed, including product type, dose, duration, and past cigarette use.
For families: avoid assuming that non-combustible nicotine products are risk-free for the eyes.
The cost and implementation barriers are not only clinical. Better research requires detailed product-use data and long follow-up, while sports settings need simple, respectful ways to talk about nicotine without turning a safety conversation into a lecture. Evidence-based messaging should be direct but not overstated.
Nicotine Cataract Risk In Community Eye Safety
The current evidence supports a cautious position: non-tobacco nicotine product exposure has been associated with higher cataract development and cataract surgery risk in a large U.S. health-record study, while findings from smokeless tobacco research are more mixed. That pattern is not enough to declare a proven causal pathway across every product. It is enough to include nicotine product history in eye-health conversations.
For sports communities, the practical message is simple. Protect eyes from known hazards, take changing vision seriously, and avoid treating newer nicotine products as harmless because they are not cigarettes. The science is still developing, but the visual stakes are easy to understand. Clear sight supports safer play, better movement, and longer participation in the games people love.
Let’s cut through the fog, shall we? Building a vision screening protocol for your team isn’t about playing optometrist.
It’s about being the savvy gatekeeper who spots the red flags before they become red tape. Think of it like a smoke detector, not a fire investigation.
This toolkit is your guide to a system that catches the obvious and guides the uncertain. It protects everyone involved—without you needing a medical degree.
We’ll blend cold, hard data from the latest studies with street-smart logistics. Why? Because missing a visual issue isn’t just a clinical oversight. It’s a career-derailer.
Ready to stop guessing and start assessing with purpose?
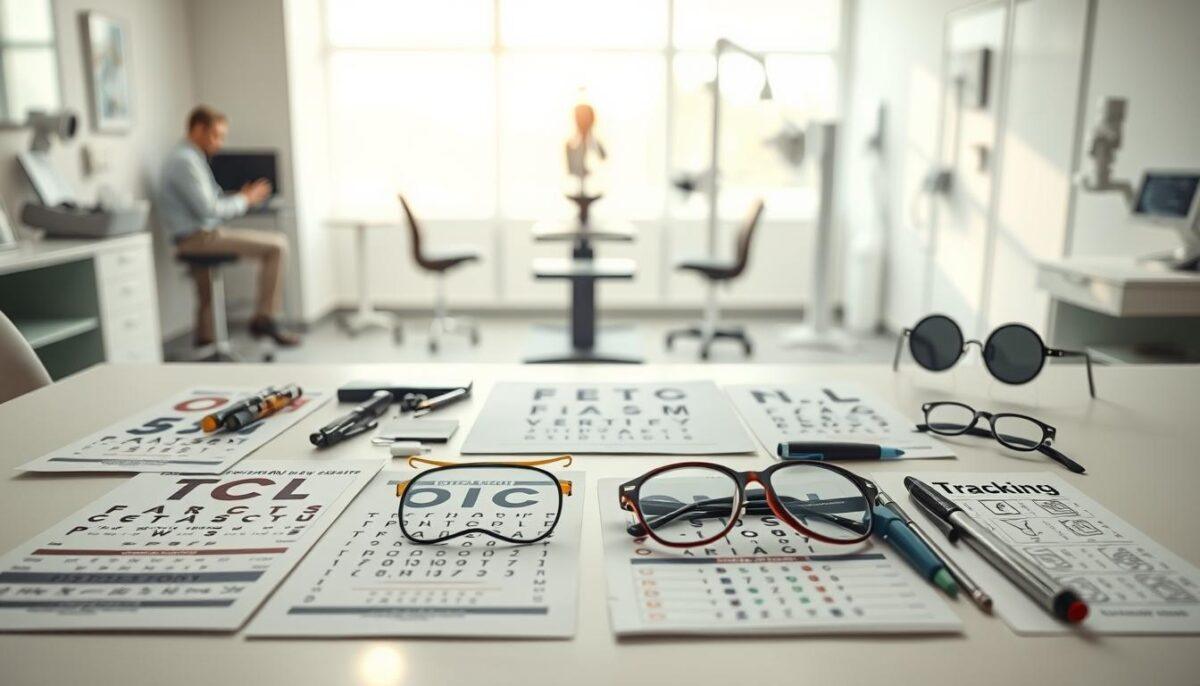
What to Include: Distance and Near Charts, Contrast Checks, Tracking, and Convergence Screens
If you think a vision test is just reading letters from far away, you’re way off. Today’s vision screening toolkit is much more advanced. It checks how well your eyes work in real life, not just at one distance.
Begin with the basics, but make them better. You need charts for both far and near vision. Life is full of close-up tasks, like reading on screens or playing sports. Near point checks help find problems that far charts miss.
Then, test how well you see different shades of gray. This is key for spotting objects in changing light. Contrast charts go beyond simple black and white letters.
Move on to tests that really challenge your eyes. These include tracking moving objects and quick eye movements. A convergence screen checks if your eyes work together well.
Research shows this mix of tests is very effective. Tools like Cambridge Crowded Acuity Cards and photoscreeners catch more issues than one test. For more on these tools, check out these comprehensive assessment kit materials.
Think of it as a detailed vision scan. It’s not just a simple check. It’s a thorough test of your visual abilities before you even start.
Simple Dynamic Tasks: Fixation, Pursuit, and Saccade Timing with a Metronome
Static charts are like theory exams. But dynamic tasks are like the real driving test for the visual system. This part of the vision screening toolkit tests how well you perform in real situations.
We’re checking three key visual skills: fixation, pursuit, and saccades. These are like the main parts of a car engine. If one part doesn’t work, the whole car stutters.
Fixation is like your visual anchor. Can the athlete focus on a single point without wobbling? Or does their eye shake like a bad internet connection? It’s not about willpower. It’s about how well their muscles work together.
Pursuit is smooth tracking. Move a pen slowly back and forth in front of them. Their eyes should follow smoothly, like a camera on a smooth shot. But if their eyes jump around, it’s like a video buffering. This shows how well their eyes work together to track moving targets.
Then, there’s saccades, quick eye movements between two points. Ask them to look back and forth between your hands. Time it with a metronome.
Using a metronome isn’t about being strict. It’s about finding out if their eyes can keep up with a rhythm. If their saccades are slow or off, it’s like their computer is slow.
This focus on dynamic fixation and teamwork isn’t just practice. Tools like the Pediatric Vision Scanner (PVS) measure binocular fixation quality. They help spot strabismus and amblyopia. Research shows that checking how eyes fixate together is key to finding big problems.
These tasks are quick, simple, and very telling. They show not just what an athlete sees, but how their visual system works under pressure. It’s the difference between having a map and knowing how to use it.
Lighting and Distance Setup: How to Avoid Bad Readings
Let’s talk about the silent saboteur of every good screening program: the environment. Your vision screening toolkit is only as reliable as the room you use it in. Think of it this way—you wouldn’t calibrate a race car’s engine with a greasy wrench in a dusty garage. So why trust vision data collected in a subpar setting?
The old computing axiom holds brutal truth here: garbage in, garbage out. You can follow the world’s most elegant protocol to the letter. But if you run it in a dimly lit hallway with glare dancing across the chart, your precious data isn’t just inaccurate. It’s fiction.
Standardization isn’t a suggestion; it’s your new religion. Start with distance. The manual says 3 meters for a reason. This isn’t arbitrary. It’s physics. An inch closer or farther changes the visual angle, skewing the acuity score. Three meters isn’t a ballpark figure; it’s a mandate. Use a tape measure. Mark the floor. Make it ritual.
Then, there’s light. This isn’t about seeing the chart. It’s about seeing it perfectly. You need consistent, bright, shadow-free illumination. Think museum lighting for a priceless painting, not the moody ambiance of a romantic dinner. Shadows create false contrast. Glare induces squinting. Both corrupt the data.
The consequence of a sloppy setup isn’t a minor oops. It’s the difference between identifying a athlete who genuinely needs a specialist and sending someone on a wild goose chase because of a false alarm. That wastes their time, the doctor’s time, and erodes trust in your entire process. This isn’t nitpicking. It’s the foundation of validity.
Factor
Ideal Setup
Common Pitfall
Impact on Data
Testing Distance
Exactly 3 meters, floor marked
“About” 10 feet, estimated
Alters visual angle, invalidates acuity norms
Lighting Quality
Even, shadow-free, ~500 lux
Dim, or single source causing glare
Creates false contrast issues, induces strain
Chart Condition
Clean, flat, no reflections
Wrinkled, glossy, or sun-facing
Adds variable difficulty, not pure vision
Data Integrity
High. Results reflect true ability.
Low. Results reflect environment.
Leads to erroneous referrals or missed issues
So, how do you lock this down? Your first defense is your logbook. When a result looks off, your first question must shift from “What’s wrong with the athlete?” to “Was the setup different today?” Meticulously note the lighting and distance in your data logs for every single session. This turns your records from a simple scorecard into a diagnostic tool. Consistent setup is the unsung hero. And detailed data logs are its sworn testimony.
Recording and Privacy: Secure Logs, Baselines, and Change Alerts
Writing down screening results on a napkin is not secure. In the world of athlete health, your data logs are very important. They tell a story that should stay private.
The first screening is like the start of a story. It sets the baseline. Every test after that adds to the story. The real magic is in the change.
A small drop in performance on your contrast charts is important. It’s like a warning light on a dashboard. It shows up before the athlete feels anything. This is why a vision screening toolkit is so valuable.
You need a system to track these changes. Paper files get lost, and shared spreadsheets are a privacy risk. You need secure, digital data logs that are easy to search. This is more than just storing data; it’s creating a living history.
Privacy is key. These results are Protected Health Information (PHI). Treating them lightly is wrong and dangerous. You need a secure system, not a post-it note. Use platforms that follow HIPAA rules, like CognitoForms. For more on setting this up, check out an open-source HIPAA compliance guide.
The best part of a good system is automation. Set up alerts for big changes from a person’s baseline. If their score drops 15%, or their contrast sensitivity changes, you’ll get a notification. This turns your vision screening toolkit into a 24/7 watchful eye. It helps you make quick, informed decisions while keeping the athlete’s story safe.
Referral Criteria: Vision Below Threshold, Persistent Symptoms, or Concussion History
Think of your referral criteria as the tripwire in a heist movie—it’s silent, precise, and when it’s triggered, everyone knows it’s time for the experts.
This isn’t about playing doctor. It’s about triage. Your vision screening toolkit has done its job by flagging an anomaly. Now, you need bright lines, not gray areas.
Let’s start with the hard numbers. The pros, like the American Association for Pediatric Ophthalmology and Strabismus (AAPOS), draw clear thresholds. For a child over four, visual acuity worse than 0.2 logMAR is a call to action. Hyperopia above +3.5 diopters or astigmatism over 1.5 diopters? That’s your tripwire.
One study found 26.5% of screened children had a visual problem. In adults and athletes, that percentage doesn’t magically shrink. The stakes just change shape—from classroom performance to split-second reaction times.
Test / Signal
Threshold for Referral
Notes / Rationale
Distance Visual Acuity
> 0.2 logMAR (worse than 20/32)
A clear deficit in resolving detail, the core of functional vision.
Significant Refractive Error
Hyperopia > +3.5D | Astigmatism > 1.5D
Indicates a high likelihood of straining the visual system, leading to fatigue and symptoms.
Persistent Symptom or History
Headaches, Double Vision, Eyestrain | Concussion History
Symptoms are data. A past concussion is a giant red flag for visual dysfunction, demanding professional referral pathways.
Which brings us to symptomology. Persistent headaches after screen time? Eyestrain that doesn’t quit? Reports of double vision? These aren’t complaints to note and forget. They are the body’s error messages.
And concussion history? That should make your referral pen twitch. It’s the ultimate signal that the brain’s visual processing software might be glitching, regardless of how the hardware “charts.”
Your protocol must be crystal. Is it a fail on two separate screening tests? Is there an observable eye turn or tracking issue? Document the *why* of the referral as meticulously as the *what*. You’re building a case file, not casting a verdict.
Remember, you are connecting dots on a map that leads to an optometrist or ophthalmologist. You are not diagnosing. This is the elegant purpose of a good screening system: to identify, triage, and route efficiently.
Clear criteria transform anxiety into action. They turn a “maybe” into a definitive next step, protecting long-term vision and performance. It’s how you move from data points to defined referral pathways, ensuring findings don’t just sit in a log but activate a chain of care. For athletes, this often integrates directly with specialized vision training protocols for recovery.
So set your tripwires. Make your map. And don’t be afraid to hand off the compass.
Build Local Care Partnerships: Optometry, Sports Med, and Communication Forms
Creating local care partnerships is more than just paperwork. It’s about building relationships that make your vision screening part of a bigger care plan. Your vision screening toolkit collects data, but it needs a purpose.
Start early. Find the optometrists, ophthalmologists, and sports medicine doctors in your area before your athlete needs a check-up. Learn about their specialties. Who deals with complex vision problems? Who knows about concussion protocols?
Your communication form is like a diplomatic letter. It clearly states: “Here’s what we found, what we did, and why we’re sending them to you.” It’s not just a note. It’s a professional way to pass on information, saving time and showing you’re committed.
Learn from public health. A referral is only a suggestion without follow-up. Your work doesn’t end when you send the form. Create referral pathways and keep them open. A quick call or message to confirm the appointment is key.
This network makes your toolkit’s data useful. A problem can easily go to a specialist for sports vision exams and treatment. You’re not just spotting issues. You’re finding solutions.
Good referral pathways protect athletes’ vision and performance for the long term. They turn your vision screening toolkit into the heart of a responsive, professional care network.
Integrate Results into Training: Tweaks, Position, and Eyewear
A convergence insufficiency on a chart isn’t a diagnosis; it’s the reason your striker keeps missing the open net. This is the analytical payoff of your vision screening toolkit. The data logs you’ve meticulously kept aren’t for filing. They’re for coaching.
Think of it as performance analytics for the human eyeball. Discover a minor convergence issue? That could be why your midfielder loses aerial duels in the box. Spot a subtle tracking lag? You’ve likely found the root of that infamous “fourth-quarter focus fade.” The logs tell the story your athletes can’t articulate.
So, what’s the play? You integrate. You tweak. This is where clinical insight becomes competitive edge. It’s not about major overhauls. It’s about smart, subtle adjustments to stance, visual cues, and gear.
Let’s translate the data. The table below maps common screening findings to their on-field symptoms and, most importantly, to actionable training adjustments.
Screening Finding
Real-World Impact
Training Integration Tweak
Convergence Insufficiency
Struggles with close-range tasks; losing headers, fumbling catches.
Incorporate “near-far” rapid focus drills using colored cues. Adjust defensive stance to improve depth perception.
Saccadic Delay (Slow Tracking)
Appears to “lose” the ball or opponent in fast transitions.
Use a metronome-paced tracking drill with multiple targets. Simplify peripheral visual cues during complex play installations.
Contrast Sensitivity Issue
Poor performance in low light or against busy backgrounds.
Recommend sport-specific tinted lenses (e.g., amber for overcast, vermilion for indoor). Use high-contrast tape on equipment during drills.
The eyewear piece is critical. It’s not just about protection anymore. It’s about optimization. That same data log might reveal an athlete who needs contrast-enhancing tints for overcast games or anti-glare coatings for indoor arenas. You’re not just stopping a finger poke; you’re upgrading their visual interface.
This is the final step in the logic chain. You’ve screened, you’ve logged, you’ve analyzed. Now you act. By weaving these tweaks into daily reps, you stop patching people up and start optimizing the human hardware they perform on. The vision screening toolkit pays its dividends right here, on the field, in the win column.
Review Cadence: Pre-Season, Mid-Season, Post-Injury, and Post-Travel Blocks
A single screening is like a Polaroid photo; a cadence is a detailed documentary of an athlete’s season. It shows the ups and downs, the slow changes, and the sudden injuries. Without a schedule, you’re just making guesses.
Creating a ruthless cadence makes your vision screening toolkit essential for your team. Let’s look at the four key screening blocks.
Each block answers a different question. The table below is your guide.
Screening Milestone
Primary Purpose
Key Test Focus
Intelligence Gained
Pre-Season
Establish the sacred baseline. This is your “Chapter 1.”
Full battery: distance/near charts, contrast, tracking, convergence.
Raw, uncontaminated data. This is the athlete’s visual fingerprint.
Mid-Season
Check for degradation from cumulative fatigue and stress.
Dynamic fixation and pursuit under timed, metronome-driven pressure.
Identifies who is visually resilient and who is breaking down under the grind.
Post-Injury (especialy head)
Non-negotiable re-screening. This is a medical directive, not a suggestion.
Convergence, saccades, and symptom tracking. Compare directly to baseline.
Objective data for return-to-play decisions. Cuts through “I feel fine” bravado.
Post-Travel Blocks
Assess the jet lag hangover. It messes with more than sleep cycles.
Reaction timing, contrast sensitivity, and simple pursuit tasks.
Quantifies the “travel tax” on visual processing before a critical game.
Why be this strict? Look at public health. The Michigan program mandates screenings at specific ages: once between ages 3-5, and in grades 1, 3, 5, 7, and 9. They don’t ask if the kid feels like it. The system triggers the check.
Your cadence should be the same—triggered by events, not the calendar. Fatigue is an event. A concussion is a major event. Crossing time zones is an event. This systematic approach is the only way to catch the slow declines, the ones that mimic “just a slump.”
It also flags the sudden shifts immediately. A drop in dynamic fixation scores post-travel? Now you have data to adjust practice intensity. A convergence failure post-concussion? You’re not waiting for symptoms to become obvious.
This cadence turns screening from a one-off event into a continuous stream of health intelligence. It’s the difference between having a snapshot and directing the entire film. Your vision screening toolkit only becomes strategic when you use it on a schedule.
Your vision screening toolkit is more than just paperwork. It’s a key tool in a world where missing a detail can change everything. It helps make safer choices.
Looking at a player’s chart can change how they play. If they have trouble tracking, it might change their position. This reduces the risk of accidents caused by unseen problems.
The biggest victory isn’t just about winning games. Early detection can prevent permanent vision loss, as shown by Michigan’s program. Your toolkit keeps your vision safe for years to come.
Use this system to find the best eye care and sports medicine experts. This is how you leave a lasting impact. Your kit ensures you see the game clearly, not just watch it.
Blue-light filters sit at a crowded intersection of sport, screen time, sleep habits, and eye safety. For athletes reviewing video after practice, students training after long study blocks, and office workers trying to reduce visual discomfort, the promise sounds simple: filter part of the light, protect the eyes, feel better. The evidence through September 14, 2026, supports a more cautious reading. Some filters may change light exposure in measurable ways, but many common claims about digital eye strain, sleep, and long-term retinal protection remain weak or uncertain.
That matters because vision is not a side issue in sport. Ball tracking, contrast detection, color judgment, and low-light awareness can affect safety and performance. A lens that feels helpful in one setting may be less useful during night training, indoor competition, or fast play under low contrast. The best question is not whether filtered lenses are good or bad. It is what outcome is being measured, under what light exposure, in which population, and with what trade-off.
What Blue-Light Filters Can And Cannot Show
Blue-Light Filters And Visual Performance
The broadest takeaway from recent evidence is that ordinary filtering lenses do not appear to damage high-contrast visual acuity under normal conditions. That is useful for athletes and coaches who worry that a mild tint might blur a scoreboard, a ball, or a teammate’s movement. The caution arrives with stronger filtering. A review published on August 30, 2026, found that stronger filters impaired color discrimination and performance in low-light or low-contrast settings. In sport terms, that could matter on a shaded field, during evening drills, or in indoor arenas where color cues and contrast are already limited.
Color and contrast are not cosmetic details. A tennis player reading a yellow ball against a green court, a cyclist judging pavement changes at dusk, or a goalkeeper tracking a ball through shadows may rely on small visual differences. If filtering shifts those cues, the gain in comfort may come with a practical cost. That does not mean every user should avoid filtered lenses. It means testing should occur in the real environment where the lens will be used, not only at a desk or in a store.
Short-Term Eye Strain Findings
The evidence for short-term digital eye strain is less supportive than marketing often suggests. The August 30, 2026, review reported that randomized trials and Cochrane reviews showed no clinically meaningful average reduction in short-term digital eye strain when blue-light-filtering spectacle lenses were compared with non-filtering lenses. The Cochrane review searched through March 22, 2022, and included 17 randomized controlled trials with sample sizes from 5 to 156 participants and follow-up periods from less than one day to five weeks. It found little or no effect on visual fatigue, critical flicker-fusion, or best-corrected visual acuity, while sleep-quality evidence was mixed and of very low certainty.
For readers who want a plain-language companion on screen claims and practical limits, our related evidence review of screen-light filters makes a similar point: lens choice is only one part of visual comfort. Breaks, blink rate, dry-eye risk, screen distance, lighting, and glare control may all matter, though the exact mix differs from person to person.
Where The Evidence Is Strongest
Laboratory Findings On Corneal Oxidative Stress
A May 2026 experimental mouse study added useful laboratory detail. In controlled conditions, exposure to blue light in the 410–480 nm range increased reactive oxygen species and led to oxidative stress in corneal tissue. A commercially available lens blocking about 50% of blue light reduced some markers of oxidative damage in that model, according to the Scientific Reports study. This is biologically interesting, but it should not be read as proof that the same lens prevents disease in people using phones, tablets, or training-room displays.
Animal models help researchers isolate mechanisms that cannot be easily tested in humans. They also have limits. Exposure conditions, tissue response, and dose may differ from typical human screen use. A finding in mouse corneal tissue is not the same as a field-tested prevention strategy for athletes or a routine recommendation for the general public. The value of the study is that it identifies a plausible pathway under controlled exposure. The missing step is clear human evidence showing meaningful outcomes in daily life.
Retinal Safety Under Typical Use
A narrative review published in June 2026 reached a firm caution against routine claims. It concluded that there was no evidence supporting the routine use of blue-blocking glasses for preventive or therapeutic purposes, and that under typical lighting and screen use, retinal exposure remains well below levels that cause photochemical damage in laboratory models, as summarized in the PubMed review. That statement does not say light exposure is irrelevant. It says the leap from laboratory hazard thresholds to everyday screen damage has not been supported.
This distinction is central to evidence-based eye health reporting. A wavelength can cause harm at a high enough dose under experimental conditions, while ordinary exposure remains below known damaging levels. Confusing those two situations can push people toward products with uncertain benefit and away from clearer habits, such as reducing glare, adjusting room lighting, taking breaks, and seeking professional care for persistent symptoms.
Limits For Athletes, Coaches, And Screen Users
Low-Light Trade-Offs In Sport
The sports setting exposes one of the main limitations of blue-light filters: a lens that reduces selected wavelengths can also alter perception. Reported adverse effects from blue-light filtering lenses are infrequent but include headache, discomfort, mood changes, and poorer color or contrast perception, especially in low light. Available trials were small, and long-term safety data remained sparse as of September 14, 2026.
For a community team, that does not call for alarm. It calls for trial use during practice before competition. A runner may find a mild filter comfortable on a bright recovery walk, then dislike it during evening speed work. A baseball player may tolerate a lens during dugout tablet review but reject it while tracking pitches under mixed sun and shade. Comfort is real, but performance and safety checks should travel with it.
Reading And Near-Work Signals
Some newer human data suggests filtered lenses can change visual behavior without improving task results. A reading-task study published online on March 12, 2026, included 34 participants and compared blue-light filtering lenses with placebo lenses. It found neurophysiological changes, including fewer and longer saccades, shorter fixations, and altered EEG alpha and delta power. Yet it did not show immediate improvements in reading performance or comprehension.
That pattern is common in early applied research: a measurable signal appears, but the practical outcome is unchanged. For athletes reviewing scouting notes, students reading playbooks, or coaches working through video clips, that means the presence of a brain or eye-movement change should not be treated as proof of better performance. It is a signal worth studying, not a settled reason to recommend routine use.
Practical Decisions Without Overclaiming
A Cautious Checklist For Lens Choice
People choose filtered lenses for many reasons: comfort, glare reduction, habit, or advice from a clinician. The safest evidence-based approach is to match the lens to a defined problem and check whether it helps without creating a new one. Anyone with eye pain, halos, sudden vision change, severe headache, or persistent symptoms should seek qualified eye care rather than relying on consumer lenses as a fix.
Define the goal: comfort during screen work, glare reduction, sleep routine, or sport-specific vision are different targets.
Test in real light: try lenses in the setting where they will be used, including low light and low contrast.
Watch color cues: stronger filters may affect color discrimination, which can matter in sport and driving.
Avoid disease claims: current evidence does not support routine preventive or therapeutic use for the general population.
There are special cases where the evidence remains more specific and less settled. In an observational cohort with neovascular age-related macular degeneration, blue-light-filtering intraocular lenses were linked with slower rates of macular atrophy enlargement compared with lenses without blue filtering. Yet no general difference in new-onset macular atrophy incidence was found in non-neovascular age-related macular degeneration populations. That is not a reason for broad self-prescribing; it is a research signal in a defined clinical context.
Across our science network, including Harvard Science Review, the same reporting principle applies: a measured effect is not automatically a public recommendation. Scale, population, exposure, and outcome decide how far a finding can reasonably travel.
Blue-Light Filters In Eye Health And Safety
Blue-light filters are best understood as tools with possible narrow uses, not universal eye protection. The evidence supports caution: high-contrast acuity is generally preserved under normal conditions, stronger filters can reduce color and low-contrast performance, average short-term digital eye strain benefits have not been clinically meaningful in randomized comparisons, and routine preventive claims remain unsupported for typical users.
For athletes and active communities, the sensible path is practical and testable. If a filter improves comfort without dulling contrast, distorting color cues, or interfering with low-light performance, it may be reasonable for that setting. If it does not help, the evidence does not support forcing the habit. Eye health decisions should stay tied to measured needs, real environments, and professional advice when symptoms persist.
Digital Eye Strain is no longer just a library-week complaint for students who also train, travel, and study on screens. A randomized controlled trial published on July 13, 2026, tested whether a 12-week sports vision training program could reduce computer vision syndrome symptoms in 200 undergraduates who reported 6 to 8 hours of daily screen exposure, mainly from laptops and smartphones 2026 randomized trial. The findings are encouraging, but they should be read as early campus-based evidence rather than a proven fix for every student or athlete.
For coaches, athletic trainers, and student health teams, the study is useful because it treats screen strain as a performance and participation issue. Sore eyes, red eyes, headaches, difficulty focusing, and neck or shoulder discomfort can make coursework harder and can also make practice feel heavier. That does not mean every symptom has the same cause. It does mean campus programs may have a reason to test low-risk training routines, track symptoms, and refer students when problems persist.
What The 2026 Digital Eye Strain Trial Found
Digital Eye Strain Measures And Student Screens
The 2026 trial enrolled undergraduates aged roughly 18 to 25. Before the intervention, 74.5% of participants were classified as computer vision syndrome positive. That high starting point matters. The study was not testing a minor annoyance in a low-risk group; it was examining a student population with heavy screen exposure and a large symptom burden at baseline.
After 12 weeks, the sports vision training group showed larger symptom reductions than the control group. In males, prevalence fell from 76.0% to 44.0%. In females, it fell from 72.0% to 38.0%. The control group had smaller, non-significant declines. Specific symptoms also moved in a favorable direction in the training group: eye fatigue or soreness dropped by about 30 percentage points, red-eye symptoms by about 28 percentage points, and symptoms such as difficulty focusing, headache, and neck, shoulder, or back pain by roughly 23 to 30 percentage points.
What The Program Included
The intervention was not a single eye exercise. It combined eye-neck-shoulder-back movement routines, FitLight reaction tasks, stroboscopic visual training using SENAPTEC strobe glasses at 0.5 to 2 Hz, multi-target tracking paired with sport-based movement, and postural cool-down work. That mix is relevant for sports settings because it connects visual attention, reaction, posture, and movement rather than asking students to stare at a near target in isolation.
All participants completed the 12-week trial, and the training group had about 85% compliance for home tasks, defined as completing at least 80% of prescribed after-school vision drills. That is a strong adherence signal for a student intervention. Still, the controlled trial setting may not match a busy campus semester with exams, travel, part-time work, and team commitments.
Why Digital Eye Strain Training May Matter For Campus Athletes
Sports Framing Without Overclaiming
The sports angle is not that vision drills magically make tired eyes healthy. The more cautious reading is that structured visual and movement tasks may help some students tolerate screen-heavy routines better, at least over 12 weeks. For student-athletes, this sits at a practical intersection: classroom screens, scouting video, messaging apps, recovery sessions, and training environments all compete for visual attention.
Community programs should resist turning one trial into a universal protocol. The study population was undergraduates, not middle-school athletes, older adults, or students with diagnosed eye disease. It measured symptom changes over a defined period. It did not prove long-term durability, nor did it establish which part of the multi-component program produced the strongest effect.
The trial also raises a fair implementation question: who delivers the sessions? A campus recreation coach, athletic trainer, optometrist, or research staff member may each bring different skills. Equipment such as reaction lights and stroboscopic eyewear can add cost and supervision needs. Low-tech posture and movement drills are easier to scale, but the study tested a combined package, so separating the effect of each component would require further research.
Screen Habits Still Need Attention
The students in the trial reported 6 to 8 hours of daily screen use. That exposure profile is familiar on campuses, but the study does not mean training can cancel unlimited screen time. Breaks, ergonomics, lighting, blink habits, and workload planning remain practical discussion points for student support teams. A related campus health discussion on student eye strain strategies gives a similar caution: trial-tested methods can help, yet evidence has limits outside the study setting.
For those interested in campus health topics across our network, including Li Live Steam, the key message is balance. Student success stories are strongest when they include both performance ambition and basic safety checks. A player who reports eye pain, repeated headaches, or persistent focusing trouble should not be told simply to train harder.
Where Blink Training Fits The Evidence
A Different Mechanism Than Reaction Drills
A separate trial of a smartphone-based blink training application reported measurable improvements in signs and symptoms of dry eye disease among digital device users, including reduced ocular discomfort and dryness blink training trial. This line of research differs from sports vision training. It focuses more on blink behavior and ocular surface comfort than on reaction tasks, tracking, or visual-attentional adaptation.
That distinction is useful for students. Redness, dryness, fatigue, and focusing difficulty can overlap in daily experience, but they may not share the same driver. A blink app may be easier to distribute than a supervised sports vision station, yet it should not be treated as a substitute for clinical evaluation when symptoms are severe, sudden, or persistent.
Practical Value And Limits
The appeal of app-based training is access. Students already use phones, and behavioral prompts may fit study sessions better than scheduled lab visits. The caution is equally clear: app engagement can fade, self-reported symptoms can be influenced by expectation, and dry eye signs do not explain every screen-related complaint.
For Digital Eye Strain, that distinction should guide campus pilots. A student with mainly dryness and discomfort may need different support than a student whose main issue is visual fatigue during fast screen-to-field transitions. The available research supports testing structured options, not assuming one pathway for all students.
How Schools And Teams Can Read The Findings
Evidence Strength In Plain Terms
The 2026 sports vision training trial was field-tested in a student population and used a randomized controlled design. That makes it more informative than a simple testimonial. The completion rate and reported compliance strengthen confidence that the program was feasible under study conditions. The symptom reductions are also large enough to deserve attention from campus wellness and sports medicine teams.
But the evidence is not settled. The intervention had several parts, making it difficult to identify the active ingredient. The trial lasted 12 weeks, so long-term maintenance remains uncertain. The research also does not prove that reduced screen symptoms translate into better grades, fewer missed practices, or improved game performance. Those outcomes would need separate testing.
Reasonable use: pilot a supervised program, track symptoms before and after, and keep referral pathways clear.
Risky use: market drills as a guaranteed treatment or tell students to ignore ongoing symptoms.
Best fit: students with heavy screen exposure who can commit to structured sessions and honest reporting.
Key barrier: staff time, equipment access, and consistency during exam periods or travel weeks.
Safety And Referral Boundaries
Student wellness programs should avoid diagnosing from a questionnaire alone. If symptoms include significant pain, sudden vision changes, persistent headache, marked light sensitivity, or symptoms that do not improve with reasonable screen and training changes, the safer step is referral to an eye care or medical professional. Training trials can inform prevention and support, but they do not replace clinical care.
That message matters in sports culture, where athletes may minimize discomfort to keep their place. A cautious coach can still be performance-minded: better symptom tracking, better sleep routines, and better referral decisions can help students stay in school and sport without turning every eye complaint into a drill assignment.
Digital Eye Strain In Student Training Decisions
The most useful takeaway from the recent student trials is not that one program solved screen strain. It is that structured visual training, movement work, and blink-focused behavioral tools are being tested in populations that look more like real campuses than old lab models did. The sports vision program reduced reported computer vision syndrome prevalence over 12 weeks in undergraduates with heavy screen exposure. The blink app study suggests that simple behavioral tools may also improve dry eye-related signs and symptoms.
For student-athletes, the decision point is practical: build support that is measurable, modest in its claims, and easy to stop or refer when symptoms do not fit the expected pattern. Digital Eye Strain deserves that kind of evidence-first response. It affects how students study, recover, and train, but the science still needs longer follow-up, clearer dosing, and better tests of which students benefit most.
Glaucoma suspect monitoring is not a one-size schedule. The evidence points toward a risk-stratified approach: some people need closer follow-up because their eye pressure, age, family history, optic nerve appearance, or visual field results suggest a higher chance of developing primary open-angle glaucoma. Others may remain stable for years and can often be observed at longer intervals under an eye care professional’s plan.
For athletes and active community members, that distinction matters. Vision is part of balance, tracking, timing, reading space, and daily safety. Still, being labeled a glaucoma suspect is not the same as having glaucoma. The research supports careful observation, repeated testing, and cautious interpretation rather than alarm. A single eye pressure reading or one borderline visual field does not usually tell the whole story.
Why Glaucoma Suspect Monitoring Is Risk-Stratified
Conversion Rates Vary By Study And Setting
Clinical studies show that conversion from suspect status to primary open-angle glaucoma is uneven across populations. A 2026 Singapore tertiary eye centre study followed 101 glaucoma suspects for five years and reported cumulative conversion rates of 17.8% at one year, 22.3% at two years, and about 25.6% by years four and five Singapore suspect study. Because this was a tertiary centre, the group may have had higher-risk features than people seen in general community screening.
That is why glaucoma suspect monitoring has to account for context. A person referred to a specialty clinic for suspicious optic nerve findings may not carry the same risk as someone with a borderline pressure reading found during a routine exam. Study design, referral patterns, testing frequency, and the definition of conversion all shape the numbers.
Eye Pressure Is Important But Not The Whole Story
The Gangnam Eye Study in South Korea, conducted from 2005 to 2011, reported a conversion rate from primary open-angle glaucoma suspect to definite glaucoma of about 4.75% per year. In that study, baseline intraocular pressure above 21 mmHg was linked with much higher incidence: about 32% among those above 21 mmHg versus about 1.05% among those at or below 21 mmHg Gangnam Eye Study.
Even with that strong signal, pressure is not a diagnosis by itself. Some people develop glaucoma at statistically normal pressure, while others have elevated pressure without documented optic nerve damage. Risk-stratified care treats pressure as one piece of the profile, alongside optic disc appearance, retinal nerve fiber layer findings, corneal measurements, visual fields, age, family history, and systemic health factors reported in the broader research record.
Risk Signals That Change Follow-Up
Higher-Risk Profiles Need Shorter Intervals
The research notes for September 2026 describe several recurring risk factors: older age, higher intraocular pressure, suspicious optic disc or retinal nerve fiber layer thinning, family history, visual field defects, thinner or biomechanically weaker corneas, myopia, diabetes, and disc hemorrhage. Race and ethnicity also appear in professional guidance, with higher risk reported among Black and Latino or Hispanic populations. These factors do not predict a person’s future with certainty, but they help clinicians decide how closely to watch for change.
In practical terms, a higher-risk patient may need more frequent pressure checks, optic nerve assessment, optical coherence tomography, and visual field testing. A lower-risk patient with stable findings may be reviewed less often. European guidance summarized in the research notes recommends that suspected glaucoma patients with optic disc anomalies or unclear field defects are often followed at six- to twelve-month intervals at first. If pressure, optic disc, and visual field results remain stable over years, intervals may be extended, and in selected stable cases follow-up may be stopped by the clinician.
Glaucoma Suspect Monitoring Signals To Track
Glaucoma suspect monitoring works best when change is measured rather than guessed. The most useful pattern is not one isolated test but a sequence: pressure trends, repeatable visual field changes, optic nerve appearance, and imaging results over time. For a basketball guard tracking a pass or a cyclist reading traffic, small visual changes can feel personal long before they look dramatic on paper, yet symptoms alone are not a reliable glaucoma screen.
Intraocular pressure: higher readings, especially repeated high readings, raise concern but need interpretation with corneal and optic nerve findings.
Optic nerve and retinal nerve fiber layer: suspicious cupping or thinning may prompt closer imaging follow-up.
Visual field testing: repeatable defects matter more than one unreliable result.
Family history and age: both can shift a patient into a closer monitoring group.
Systemic factors: diabetes, hypertension, dyslipidemia, and cardiovascular disease appeared as predictors in cohort research cited in the research notes, though associations do not prove direct causation for every individual.
Community health reporting often faces the same challenge as sports reporting: separating signal from noise. A single poor performance does not define an athlete; a single borderline eye test may not define disease. Patterns deserve attention. For readers interested in broader community science coverage from the same network, visit Illinois Energy for related public-interest reporting beyond eye health.
Testing Frequency And Evidence Limits
Visual Field Testing Needs Repetition
Visual field testing is demanding. Fatigue, learning effects, attention, dry eye, and test anxiety can affect reliability. That is one reason guidelines summarized in the research notes call for repeated fields, especially early after diagnosis or suspect labeling. High-risk patients may need several reliable visual field tests in the first two years to detect rapid change early. Lower-risk suspects may be tested less intensively, depending on clinician judgment and stability.
For active people, this is similar to repeating sprint timing or balance testing after a minor injury: one result is useful, but repeated valid measures show trajectory. The difference is that glaucoma-related damage, once confirmed, is generally not treated as reversible. That raises the value of early detection while also raising the need to avoid overcalling disease from noisy data.
Imaging Helps, But It Does Not Replace Clinical Judgment
Optical coherence tomography can document retinal nerve fiber layer and optic nerve changes, yet imaging artifacts and normal anatomic variation can mislead. Visual fields can be variable. Eye pressure changes throughout the day. Corneal thickness and hysteresis can influence pressure interpretation. These are reasons glaucoma suspect monitoring remains a clinical process, not a single-device answer.
Some research tools may improve future risk prediction, but the supported approach in the research notes remains periodic imaging, pressure measurement, visual field testing, and optic nerve assessment. For related discussion of community eye checks and risk awareness, our site has covered eye health assessments with a similar caution: screening can guide action, but diagnosis and treatment decisions belong in clinical care.
How Risk-Stratified Care Protects Daily Performance
Sports Vision Depends On More Than Sharpness
Open-angle glaucoma is often discussed through pressure numbers and optic nerve photographs, but community athletes understand vision in movement. Peripheral awareness, contrast, reaction timing, and safe spacing all matter in sport and daily activity. A person can read an eye chart well yet still have early field changes that deserve evaluation. That does not mean every suspect should worry about sports participation. It means stable, documented follow-up is the safer path than assuming clear central vision tells the whole story.
Risk stratification can also reduce unnecessary burden. A young, untreated, low-risk person with stable exams may not need the same appointment frequency as an older patient with elevated pressure, family history, and suspicious nerve findings. The research notes describe wide differences in estimated conversion risk between low- and high-risk groups. That spread supports matching follow-up intensity to risk rather than applying the same calendar to everyone.
Monitoring Is Not The Same As Treatment
The research notes state that treatment, including pressure lowering, may be considered when multiple risk factors are present or when there is evidence of early damage or conversion. That is different from saying every glaucoma suspect needs medication. Treatment has costs, adherence demands, possible side effects, and quality-of-life tradeoffs. Observation also has risks if the interval is too long for a high-risk person. The safer evidence-based message is that clinicians weigh the full risk profile, test quality, and documented change before deciding.
For patients, the best preparation is not self-diagnosis. It is bringing family history, prior eye records, medication lists, and systemic health history to appointments. If a visual field test went poorly because of fatigue or confusion, saying so helps the clinician judge reliability. If sport or work depends heavily on peripheral awareness, that context is worth sharing.
Glaucoma Suspect Monitoring In Practice
Glaucoma suspect monitoring is a structured way to answer a careful question: who is likely enough to convert to primary open-angle glaucoma that closer follow-up or treatment discussion is warranted? The available evidence supports risk-based intervals, repeated testing, and attention to change over time. It does not support panic after one abnormal measurement, and it does not support ignoring a high-risk pattern.
The most cautious reading of the research is also the most practical. High eye pressure, older age, family history, suspicious optic nerve or retinal nerve fiber layer findings, and repeatable visual field changes should push monitoring closer. Stable findings over years may allow longer intervals under professional guidance. For community athletes, workers, drivers, and older adults, that balance protects both eye health and daily function without overstating what any single study can prove.
OCTA glaucoma progression research has become one of the more closely watched areas in glaucoma monitoring, because it measures blood-flow-related vessel density rather than only nerve fiber thickness or visual field performance. For athletes, coaches, and community eye-health advocates, the key question is practical: can this imaging signal flag risk earlier without creating false confidence or unnecessary alarm?
Optical coherence tomography angiography, often shortened to OCTA, is not a stand-alone answer. The recent evidence points to a useful signal, especially around radial peripapillary capillary and optic nerve head vessel density. Yet the same evidence also shows that OCTA and standard OCT do not always identify the same eyes as progressing. That makes the technology promising as part of a monitoring set, not a replacement for clinical judgment, pressure assessment, optic nerve evaluation, and visual field testing.
What OCTA Glaucoma Progression Studies Found
OCTA Glaucoma Progression And Field Loss
A 2026 Scientific Reports study followed 116 eyes, including 85 eyes with glaucoma and 31 glaucoma-suspect eyes, at roughly four-month intervals for about 33.3 months. The investigators reported that faster radial peripapillary capillary vessel-density loss on OCTA correlated with faster central and peripheral standard automated perimetry progression, with beta values from −1.63 to −2.17 percent per year and p values at or below 0.01 Scientific Reports study. That finding supports a biologically plausible connection between microvascular change near the optic nerve and later functional decline.
The strength of this kind of evidence is the repeated follow-up design. Glaucoma is a long-term disease process, so a single image can only tell part of the story. A rate of change, especially when measured over several visits, is more relevant to patient risk than one isolated measurement. In sports terms, one sprint split matters less than the trend across a training block.
Why Vessel Density Is Getting Attention
OCTA vessel-density measures may capture a different part of the glaucoma process than retinal nerve fiber layer thinning. The research notes describe multiple recent cohorts in which faster vessel-density decline was associated with visual field progression. That does not prove that reduced vessel density causes the visual field loss. It does suggest that the vascular signal may track with clinically meaningful change.
That distinction matters for patients. A test can be useful without being a cure, a diagnosis by itself, or a full explanation of the disease. OCTA glaucoma progression signals appear most valuable when clinicians interpret them beside visual fields, retinal nerve fiber layer trends, optic disc appearance, intraocular pressure history, and scan quality.
Detection Timing And Agreement Limits
Earlier Does Not Always Mean Certain
Several research findings in the notes suggest OCTA may detect change before visual field testing in some eyes. Reported lead times vary by cohort, method, disease stage, and statistical approach. The cautious reading is that OCTA may give clinicians an earlier warning signal, but earlier detection is only useful if the signal is repeatable and fits the rest of the clinical picture.
Short-interval change is a key concern. One study in the research notes found statistically significant changes over a six-month interval in peripapillary vessel density, retinal nerve fiber layer thickness, and mean deviation, but the changes were largely within test-retest variability. That means a small movement in a number may not equal true progression. For athletes used to performance data, the comparison is familiar: a single wearable metric can drift because of sensor noise, sleep, hydration, or device placement. Eye imaging has its own version of that problem, including scan quality and segmentation differences.
Agreement Across Tests Was Low
An event-based study of 147 glaucoma eyes reported that OCTA identified progression in 33 eyes, OCT in 25 eyes, and visual field testing in 11 eyes. Specificity in healthy eyes stayed above 90 percent for both OCT/OCTA and OCT alone, while agreement between OCTA and OCT was described as slight, with kappa below 0.10 event-based OCTA study. This is one of the more practical findings for clinics: the tools may be complementary because they flag different eyes.
Low agreement can be read two ways. It may mean OCTA is finding early biological change that other tests miss. It may also mean some OCTA findings reflect measurement noise or modality-specific thresholds. The available evidence does not support treating every OCTA change as definite disease worsening. It supports repeat testing, quality control, and comparison across modalities.
How OCTA Glaucoma Progression Fits Clinic Flow
Workflow Matters For Real Patients
For community clinics, the value of OCTA depends on more than statistical significance. Scan time, image quality, staff training, cost, reimbursement, and patient comfort all affect whether a promising measurement becomes dependable care. A patient who cannot keep steady fixation may produce images that are hard to compare over time. A busy clinic may also need clear rules for when OCTA adds enough information to justify extra imaging.
Those workflow issues connect with broader imaging questions, including OCT acquisition efficiency in glaucoma testing. Faster or more stable scans can help, but efficiency is not the same as accuracy. A quick scan still needs sufficient quality before anyone should base decisions on it.
What Athletes And Active Adults Should Hear
For athletes, the main message is not that OCTA predicts performance or sports readiness. It does not. The relevance is eye safety and continuity of care. Active adults may delay routine eye visits because they feel healthy and see well during play. Glaucoma can progress before a person notices a field defect, so a structured monitoring plan can matter, especially for people already diagnosed or considered suspects by an eye-care professional.
OCTA glaucoma progression cannot replace a full glaucoma evaluation. It also should not be used by patients to self-diagnose or change medication. The evidence supports a conversation with an ophthalmologist or optometrist about whether OCTA is useful in a specific case. For readers who follow community-centered science and sport coverage across our network, SGTT provides similar public-interest content focused on practical understanding rather than overhyping advancements.
OCTA may add early structural or microvascular information in some glaucoma and glaucoma-suspect eyes.
Repeatability and scan quality are central because small changes can fall within variability.
Visual field testing remains necessary because function is what patients live with day to day.
OCTA and OCT may identify partly different groups of progressing eyes, so disagreement is not rare.
OCTA Glaucoma Progression For Team Eye Safety
A Careful Role, Not A Stand-Alone Verdict
The strongest practical interpretation is that OCTA glaucoma progression research supports a cautious add-on role. Vessel-density loss appears associated with visual field decline in recent studies, and event-based data show that OCTA can identify progression in eyes not flagged by other tests. The evidence is not yet a reason to abandon visual fields, retinal nerve fiber layer imaging, optic nerve examination, or pressure monitoring.
For team physicians, trainers, and family members who help athletes stay engaged with care, the best use of this evidence is to encourage regular, professional eye follow-up when glaucoma is already diagnosed or suspected. OCTA may help clinicians see risk patterns earlier, but the patient-facing goal remains clear: protect usable vision, reduce missed progression, and avoid overreacting to a single uncertain data point.
OCTA glaucoma progression is best understood as an early signal under active study. It is field-tested in clinical research and increasingly used in ophthalmic imaging, but implementation still depends on cost, staff experience, device consistency, and careful interpretation. The science is moving in a useful direction, provided the claims stay matched to the evidence.
Student eye strain has become a practical concern for families, teachers, coaches, and student-athletes who split their days between classrooms, laptops, phones, and training schedules. The best recent evidence does not support a single cure. It points instead to a layered plan: active visual training in selected groups, scheduled breaks, workstation changes, symptom tracking, and careful use of supplements only where the evidence fits the person and goal.
As a community advocate, I hear from students who want to study without headaches or tired eyes, then show up sharp for practice. Sports vision science can help frame that problem, but it also calls for restraint. A trial can show improvement in one population without proving that every school, team, or family will see the same result. That distinction matters, especially for young people.
Student Eye Strain Evidence From Recent Trials
What Did Student Eye Strain Trials Measure?
Recent trial data used computer vision syndrome, often called digital eye strain, as a measurable outcome. On July 13, 2026, a 12-week randomized controlled trial of 200 college students with high daily screen exposure reported that a Sports Vision Training program reduced computer vision syndrome prevalence in the intervention group from about 74.5 percent at baseline to about 41 percent after the program. The control group had only small, non-significant reductions, according to the peer-reviewed report in the Sports Vision Training trial.
The same study reported symptom-specific reductions in red eyes, eye fatigue or soreness, difficulty focusing, headaches, neck, shoulder, and back pain, and reduced concentration. Those findings are promising because they connect visual strain with school performance concerns and physical comfort. Still, the participants were college students with heavy screen exposure, not younger children, and the study lasted 12 weeks. Schools should treat it as field-tested evidence in a defined group, not as proof that the same program will work for every grade level or every symptom pattern.
How Strong Is The Sports Vision Signal?
The sports vision angle is interesting because it asks students to train visual attention and visuomotor skills rather than only reduce screen time. That makes sense for student-athletes, who often need sustained focus, quick shifts in attention, and comfort under visual load. Yet active training takes time, staff support, and adherence. If a campus cannot run sessions consistently, the results may not match the trial.
This is where cautious reporting matters. The trial supports a possible benefit from a structured program for high screen-use college students. It does not show that casual eye drills, random app use, or unverified performance claims will produce the same effect. Readers who want a broader critique of performance claims can compare the evidence with this review of eye exercises and performance.
Practical School Steps With Cautious Expectations
Breaks, Desk Setup, And Dryness
For many classrooms, the first realistic layer is behavior and setup. Research in the provided evidence set included a two-week reminder-based trial, published in April 2023, where symptomatic computer users used software reminders to follow the 20-20-20 rule. Self-reported digital eye strain and dry eye symptoms decreased, although ocular surface signs were not sustained one week after the reminders stopped. That pattern suggests reminders may help behavior while they are in use, but the effect may fade when support is removed.
An ergonomics-based intervention among medical students in 2025 combined counseling with practice for two weeks. In that study, computer vision syndrome symptom prevalence dropped from about 41.2 percent to about 18.4 percent, and median scores improved. Burning, itching, and tearing improved most, while blurred vision and headache did not improve significantly. That mixed result is useful for schools: desk setup and screen habits may reduce some symptoms, but they may not solve every complaint.
Use scheduled visual breaks during long screen blocks rather than relying on memory alone.
Set screens at a comfortable distance with a slight downward gaze when possible.
Reduce glare from windows, overhead lights, and shiny desk surfaces.
Ask students to report patterns, such as symptoms after long reading blocks or late-night device use.
Refer persistent, worsening, or unusual symptoms to an eye care professional rather than treating them as routine fatigue.
Training Time, Staffing, And Cost
Implementation is the hard part. A reminder tool is low cost, but students may ignore pop-ups if assignments are due. Ergonomic counseling is practical, but it requires teachers or health staff to repeat the steps until they become routine. Sports Vision Training is more active and may require trained supervision, a quiet space, and time away from other school demands.
For schools with limited resources, a staged plan is more realistic than a campus-wide program launched all at once. Start with break reminders and workstation checks in classes that use screens heavily. Track symptom reports for a few weeks. If a school has athletic trainers, vision specialists, or occupational health partners, it can then consider a structured visual training pilot for older students with high screen exposure.
Nutrition Findings And What They Do Not Prove
Lutein And Zeaxanthin In High Screen Users
A separate randomized, double-blind, placebo-controlled study by Lopresti and Smith, published in February 2025, tested 10 mg lutein plus 2 mg zeaxanthin for six months in high electronic screen users aged 18 to 65. The study reported improvements in objective measures such as tear film break-up time, Schirmer tear test, and photo-stress recovery time, while subjective reports did not differ from placebo, as listed in the PubMed record.
That finding deserves a careful reading. Objective eye measures improved, but participants did not report clear symptom differences compared with placebo. The study population was broader than students alone. It does not justify telling families that supplements will fix student eye strain, and it should not replace an eye exam, allergy care, dry eye evaluation, sleep review, or screen-habit changes when those are needed.
Cost also matters. A supplement taken for six months is not the same as a free classroom break schedule. Families should avoid stacking products based on marketing claims. If a student has dietary restrictions, medical conditions, or uses medications, supplement decisions belong in a discussion with a qualified clinician.
Community Q And A For Students And Coaches
Can Student Athletes Use These Findings?
Yes, but with limits. Student-athletes may be a good fit for structured visual routines because they already understand practice, tracking, and gradual progress. A coach might help by protecting rest breaks during film review, reducing glare in team study rooms, and avoiding long device sessions immediately before sleep when possible. None of those steps require a medical claim; they are common-sense exposure and comfort controls supported by the direction of recent research.
Community stories help families see that eye comfort is part of participation, not a side issue. For those interested in athlete-centered outreach, Lili Lives Team provides related community sports stories that ensure students and families stay informed and connected.
One common question is whether blue-light filters should be the first step. The evidence set described mixed awareness of protective practices among students and practical guidance that includes brightness control and avoiding bright screens before sleep. Filters may help some users feel more comfortable, but they should not distract from breaks, glare control, screen distance, and referral for symptoms that do not behave like ordinary fatigue.
Student Eye Strain In School Communities
A Measured Plan For Classrooms And Teams
A careful school plan for student eye strain should be simple enough to use and honest about what is known. The strongest recent student-specific signal in the research set came from the 12-week Sports Vision Training trial in college students. Shorter reminder and ergonomics interventions also showed benefits, though some effects were limited by follow-up length or symptom type. Nutrition evidence is interesting but less direct for student symptom relief.
A practical model is to start with the lowest-burden steps, measure response, and then decide whether a more structured program is worth the time. Teachers can build screen breaks into class flow. Coaches can schedule film sessions with pauses and room lighting checks. Students can record symptoms in plain language: tired eyes, dryness, focusing trouble, headache, neck pain, and concentration changes. If patterns persist despite basic changes, referral is the safer path.
The success story here is not a miracle fix. It is a student who learns that visual comfort can be observed, supported, and discussed without blame. Evidence gives communities a better script: reduce avoidable strain, test changes in real settings, and avoid claims that run ahead of the data.
In glaucoma care, OCT acquisition efficiency is not just a stopwatch measure. It affects clinic flow, patient comfort, repeat imaging, and how confidently clinicians can use structural data alongside visual fields and eye pressure history. For athletes, coaches, and community health teams, the lesson is familiar: a test that works well in controlled settings still has to perform under real pressure, with real people, and with enough reliability to guide cautious decisions.
OCT acquisition efficiency And The 2026 Device Comparison
A July 2026 head-to-head study compared the Spectralis OCT2 module with the Zeiss Cirrus HD-OCT Model 6000 in 37 glaucoma or glaucoma-suspect patients, covering 72 eyes in people aged 50 years or older. The study reported that Cirrus 6000 had a significantly faster total acquisition time: 115.9 ± 44.7 seconds compared with 157.2 ± 46.4 seconds for Spectralis OCT2, a mean difference of about 41 seconds with p < 0.001. The RNFL portion showed an even larger time gap: 50.8 ± 29.7 seconds for Cirrus compared with 99.5 ± 32.7 seconds for Spectralis, according to the July 2026 OCT comparison.
Why OCT acquisition efficiency Matters In Clinic Flow
That time difference is not trivial in a busy glaucoma service. A clinic seeing many patients with suspected or established disease can lose or gain appointment capacity based on scan duration, repeat attempts, and patient fatigue. Faster RNFL acquisition may help staff complete imaging before blinking, fixation loss, or discomfort interferes. Yet speed alone should not be treated as diagnostic superiority. A shorter scan can support workflow, but the scan still needs usable image quality and clinically meaningful interpretation.
Speed Findings From July 2026
The July 2026 findings are best read as evidence about acquisition performance, not as a claim that one device diagnoses glaucoma better in every setting. The cohort was modest in size, and it included glaucoma and glaucoma-suspect patients rather than a broad population screening sample. In that sense, OCT acquisition efficiency is a practical metric: it tells us how long image capture took in a defined study group, while leaving separate questions about cost, staffing, software interpretation, and long-term progression monitoring.
Reliability Versus Speed In Real Imaging Conditions
The same comparison also found a trade-off that equipment buyers should take seriously. While Cirrus was faster for total acquisition and RNFL imaging, Spectralis OCT2 was reported as more reliable in challenging imaging conditions, with higher completion rates and fewer repeat scans required. That matters for older patients, people with ocular surface irritation, media opacity, poor fixation, or other factors that make imaging harder.
Macular Scan Time Was Not The Main Difference
The study did not find a significant difference in macular-scan acquisition times between devices, with p = 0.180. That detail helps narrow the interpretation. The headline speed difference came largely from RNFL scanning, not from every part of the imaging session. For clinics that rely heavily on macular ganglion cell measures, the operational advantage may be smaller than the total-time result first suggests.
Repeat Scans Change The Practical Math
Repeat scans can erase some of the time saved by a faster first attempt. If one device is quicker but requires more retries in difficult eyes, the lived workflow may look different from the average acquisition time. This is much like sport testing: a sprint split matters, but so does whether the athlete can repeat the effort without technical breakdown. For OCT devices, repeatability and completion rate sit beside speed as safety checks against overreading a single attractive number.
Diagnostic Signals Beyond The Stopwatch
Acquisition data should be paired with evidence that structural OCT measurements relate to glaucoma status and duration. In the Ocular Hypertension Treatment Study analysis reported in 2026, 646 participants had OCT imaging. Eyes that developed primary open-angle glaucoma had global RNFL thickness 11.1 to 12.7 µm thinner than eyes without primary open-angle glaucoma, and global GCIPL was 4.5 to 7.6 µm thinner; all reported comparisons had p < 0.001 using both Spectralis and Cirrus OCT, as described by WashU Research Profiles.
Structural Differences In OHTS
The OHTS data support OCT as a structural measurement tool in people followed for ocular hypertension and glaucoma outcomes. The finding that RNFL and GCIPL were thinner in eyes that developed glaucoma is consistent with OCT’s value in detecting structural damage. The same report stated that eyes at least 10 years after primary open-angle glaucoma diagnosis showed about 10% thinner RNFL and GCIPL than eyes with shorter disease duration.
What The Numbers Can And Cannot Say
These data do not mean OCT alone diagnoses glaucoma or determines treatment. Glaucoma assessment still depends on clinical context, including optic nerve appearance, intraocular pressure history, visual field testing, risk factors, and scan quality. Separate diagnostic meta-analytic evidence in the research base has reported pooled OCT sensitivity and specificity in the mid-to-high 80% range for distinguishing glaucoma from healthy eyes, but pooled figures can hide variation by device type, disease stage, scan region, and study design. The cautious reading is that OCT is powerful, not infallible.
Equipment Selection Lessons For Glaucoma Clinics
For administrators and clinicians, device selection should not be reduced to brand preference or the shortest mean scan time. The acquisition study points to a concrete workflow advantage for Cirrus 6000 in total and RNFL acquisition time, while also pointing to reliability strengths for Spectralis OCT2 under harder imaging conditions. A clinic with many straightforward scans may value speed differently from a referral center seeing more challenging eyes.
OCT acquisition efficiency Is A Workflow Metric
OCT acquisition efficiency should be judged against the full imaging pathway: patient positioning, fixation coaching, scan completion, repeat attempts, segmentation review, and how easily clinicians can compare results over time. Faster acquisition can reduce bottlenecks, but poor repeatability or low completion rates can create downstream work. Staff training also affects performance, and the research provided here does not give cost data, service-contract comparisons, or maintenance burden.
Cost And Training Questions Remain Open
The 2026 comparison was field-relevant because it used glaucoma and glaucoma-suspect patients, but it was still limited by sample size. Clinics making purchase decisions would need local pilot testing, including technician feedback and image-quality review. Readers who are interested in exploring more about materials and technology topics can check out Kilburn Chemicals for related information. For functional testing context, a related review on visual electrophysiology in glaucoma offers a cautious look at adjunct tools rather than replacements for standard assessment.
Speed: Cirrus 6000 was faster for total acquisition and RNFL imaging in the July 2026 comparison.
Clinical signal: OHTS data linked thinner RNFL and GCIPL measurements with primary open-angle glaucoma status and longer time after diagnosis.
Limit: Device speed does not, by itself, establish diagnostic accuracy or patient outcome benefit.
OCT Devices In Glaucoma Diagnostics
The most balanced interpretation is that OCT devices are valuable, evidence-supported tools for structural glaucoma assessment, but equipment claims need careful reading. OCT acquisition efficiency can improve patient throughput and may reduce strain during imaging, especially where RNFL scans are central to the visit. Yet reliability in difficult eyes, repeat scan needs, macular performance, staff skill, and longitudinal comparability all affect the real value of a device. For community clinics, sports vision programs, and specialty practices, the best use of OCT remains evidence-based: measure carefully, confirm quality, compare over time, and avoid treating any single scan as the whole story.
Sports Vision Training has moved from a niche performance idea into a serious mental conditioning topic because recent reviews and trials suggest it may help athletes respond faster, choose better options, and execute sport-specific skills with greater accuracy. The evidence is not uniform, and it does not support one magic drill for every player. What it does support is more practical: visual-cognitive work appears most useful when it is repeated over time, tied to real sport demands, and measured against outcomes that matter to coaches and athletes.
What Sports Vision Training Can Support
In athletic settings, vision is not just eyesight on a chart. It includes tracking moving objects, shifting attention, reading body cues, reacting under time pressure, and coordinating the eyes with hands, feet, or a racket. That is why multicomponent programs are gaining attention. They combine visual perception, decision tasks, reaction drills, and sport-like movement rather than asking an athlete to stare at a screen and hope the skill transfers to competition.
Sports Vision Training And Decision Speed
The strongest case for Sports Vision Training sits in time-dependent performance. A July 28, 2026 meta-analysis described large improvements in response-time outcomes for multicomponent visual-cognitive and perceptual-motor training batteries compared with controls. That finding fits with the way athletes describe high-speed play: the best performers often seem to see the next pass, swing, or defensive gap earlier than others. Science cannot prove that every trained athlete will gain that edge, but it can test whether reaction and decision measures improve under controlled conditions.
Accuracy Matters As Much As Speed
Speed without accuracy can become noise. The same 2026 research summary reported significant gains in accuracy-dependent outcomes for trained athletes. That distinction matters for community teams, school programs, and college athletes because a faster decision only helps if it leads to a better action. In racket sports, that might mean placing the shuttle into a target zone. In soccer, it may mean reacting to a cue without losing control of the ball. In baseball or softball, it may mean recognizing pitch information soon enough to guide the swing, though transfer to game statistics still needs careful study.
Evidence From Reviews And Trials
A 2025 meta-analysis in the Scandinavian Journal of Medicine & Science in Sports reviewed 27 randomized controlled trials involving 669 athletes and found that visual training significantly improved decision-making response time and sport-specific performance according to PubMed. For athletes and coaches, that is more persuasive than a single success story because randomized trials reduce some sources of bias. Still, the review grouped different sports, training tools, and outcome measures, so the result should be read as supportive evidence rather than a universal guarantee.
Field-Tested, But Not Settled
The research is no longer purely theoretical. It includes field-tested programs in athletes, including a 2026 randomized controlled trial of collegiate badminton players aged 18 to 25. In that four-week study, a wearable-prism training group showed significant between-group improvements in reaction time and target-zone accurate hits, while binocular visual function metrics were unchanged in the open-access trial. That is useful because it separates performance-related visuomotor outcomes from broader claims about changing the visual system itself.
For mental conditioning staff, the badminton result carries a practical message: training may improve selected task outcomes without proving a wider eye-health effect. That distinction protects athletes from inflated promises. It also keeps the conversation grounded. A program can be worthwhile if it helps an athlete react and hit more accurately in a defined task, but that does not make it a medical treatment or a replacement for eye care.
Designing Sport-Like Vision Work
The best-supported approach is not random visual exercise. Recent reviews point toward naturalistic training, meaning drills that resemble the athlete’s real cues, timing, and movement demands. A goalkeeper tracking ball flight and shooter hips faces a different visual problem than a badminton player reading racket angle or a basketball guard scanning help defense. That is why Sports Vision Training should be planned around the sport’s actual perceptual load.
Multicomponent Beats Isolated Guesswork
A multicomponent plan may include object tracking, peripheral awareness, reaction timing, visual search, and decision tasks paired with movement. The value is not that each drill is special on its own. The value is that the training system asks the athlete to see, decide, and act under conditions that resemble practice pressure. For a practice-facing companion, our earlier report on sports vision training in athletic practice explains why short-term gains should be tracked before assuming match transfer.
Match the cue: Use balls, opponents, body movement, or sport-specific video rather than generic flashes alone.
Repeat across sessions: Research on stroboscopic approaches suggests multi-session programs show stronger effects than single exposures.
Measure more than reaction time: Track accuracy, decision quality, and performance tasks close to the sport.
Protect the eyes: Training should not encourage unsafe glare exposure, poor lighting, or play through visual discomfort.
Community coaches often ask whether the equipment needs to be expensive. The research does not support a single answer. Some studies use wearable devices, stroboscopic lenses, or prisms; others use visual-cognitive tasks and sport-specific drills. Cost, staffing, athlete age, and access to trained supervision all shape whether a program is realistic. A small club may start with structured tracking and reaction drills, while a college program may test devices under closer monitoring.
Implementation Barriers For Teams
The main caution is heterogeneity. Recent reviews report that effects vary by sport, training dose, athlete level, and outcome type. That means a program that helps collegiate badminton players over four weeks should not be assumed to help every youth soccer player, sprinter, or swimmer in the same way. Coaches should resist the urge to copy a protocol without asking whether the visual task matches the sport.
Measurement Can Keep Expectations Honest
Before adding Sports Vision Training to mental conditioning, teams need baseline measures. These can include reaction time, decision accuracy, target-hitting precision, visual search tasks, or coach-coded sport scenarios. The key is to test the same outcome before and after the program. If the athlete improves on a lab-style task but not on a sport-like task, that result should guide the next block of training.
Methodological limits remain a real issue. Some studies have small samples, short interventions, limited blinding, or little follow-up. Far-transfer outcomes, such as official match statistics or long-term retention, are less common than short-term task scores. This does not erase the positive findings, but it does narrow what can be claimed. The evidence is encouraging for selected performance measures, not settled for every form of competitive success.
There is also an eye safety angle. Athletes with new visual symptoms, headaches, double vision, eye pain, field loss, or difficulty seeing should not be placed into performance drills as a first response. They need appropriate clinical evaluation. Training for performance is separate from diagnosis or treatment. That boundary matters in youth sport, where athletes may feel pressure to hide symptoms to keep their spot.
Readers interested in broader scientific findings can explore related topics through Harvard Science Review, a related site in the same network. The shared standard is simple: performance claims should rise or fall on the quality of the evidence, not on the appeal of the technology.
Sports Vision Training In Athletic Performance
The fair reading as of September 4, 2026 is that Sports Vision Training can be a useful part of mental conditioning when it is sport-like, repeated, measured, and presented honestly. It may help athletes improve response time, accuracy, and selected sport-specific tasks. It may be especially relevant in open-skill sports where the player must track moving objects, read opponents, and act under time pressure.
The caution is just as clear. Benefits are not automatic, and not every study proves transfer to real competition. Teams should treat Sports Vision Training as a performance training tool with promising evidence, not as a cure-all. The strongest programs will likely be those that pair visual demands with the athlete’s existing technical and tactical work, then track whether the gains show up where the athlete actually competes.